

Published:
January 3, 2017

falco feeds by sysdig
Falco Feeds extends the power of Falco by giving open source-focused companies access to expert-written rules that are continuously updated as new threats are discovered.
learn more

This blog was initially posted by an awesome member of the sysdig community, Kamol Mavlonov on http://blog.microservices.today/. He covers how to get up and running with Dashboards and Alerts to monitor the CPU, Memory, and Disk utilization in your mesos environments.
\r\r
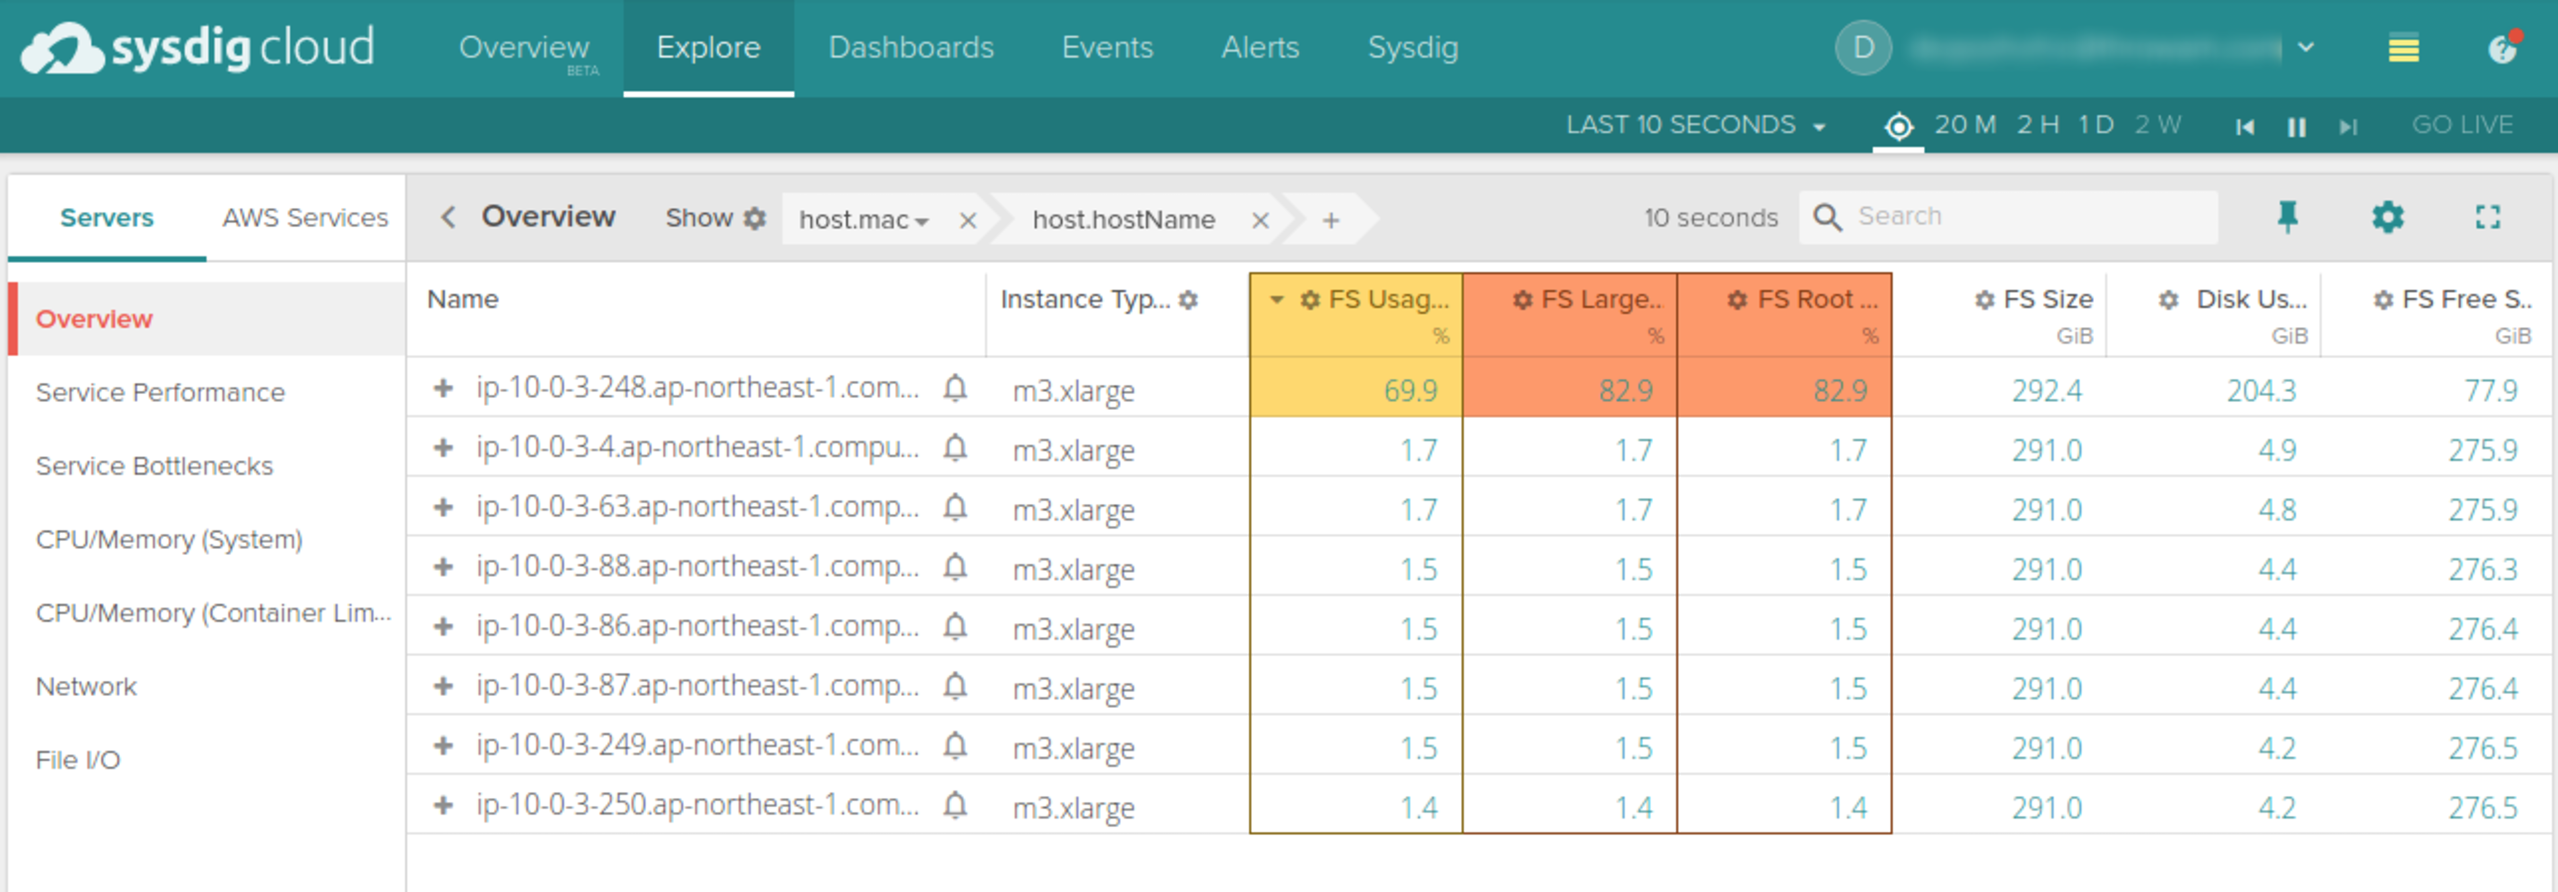
Creating a Disk Utilization Dashboard
\r\r
- \r
- Under Explore tab select Server -> Overview. \r
- Choose Group by host (host.mac). \r
- On Table columns configuration (gear icon) Select the following fields \r
\r\r
- \r
fs.used.percent– FS Usage % \rfs.root.used.percent– FS Root Usage % \rfs.largest.used.percent– FS Largest Usage % \rfs.bytes.total– FS Size \rfs.bytes.free– FS Free Space \rfs.bytes.used– Disk Used Bytes \r
\r\r
- \r
- Change the color coding by clicking on the gear icon of each of the columns. (default is yellow after 50% and red after 80%) \r
- Pin the tab to the dashboard. \r
\r\r
\r\r
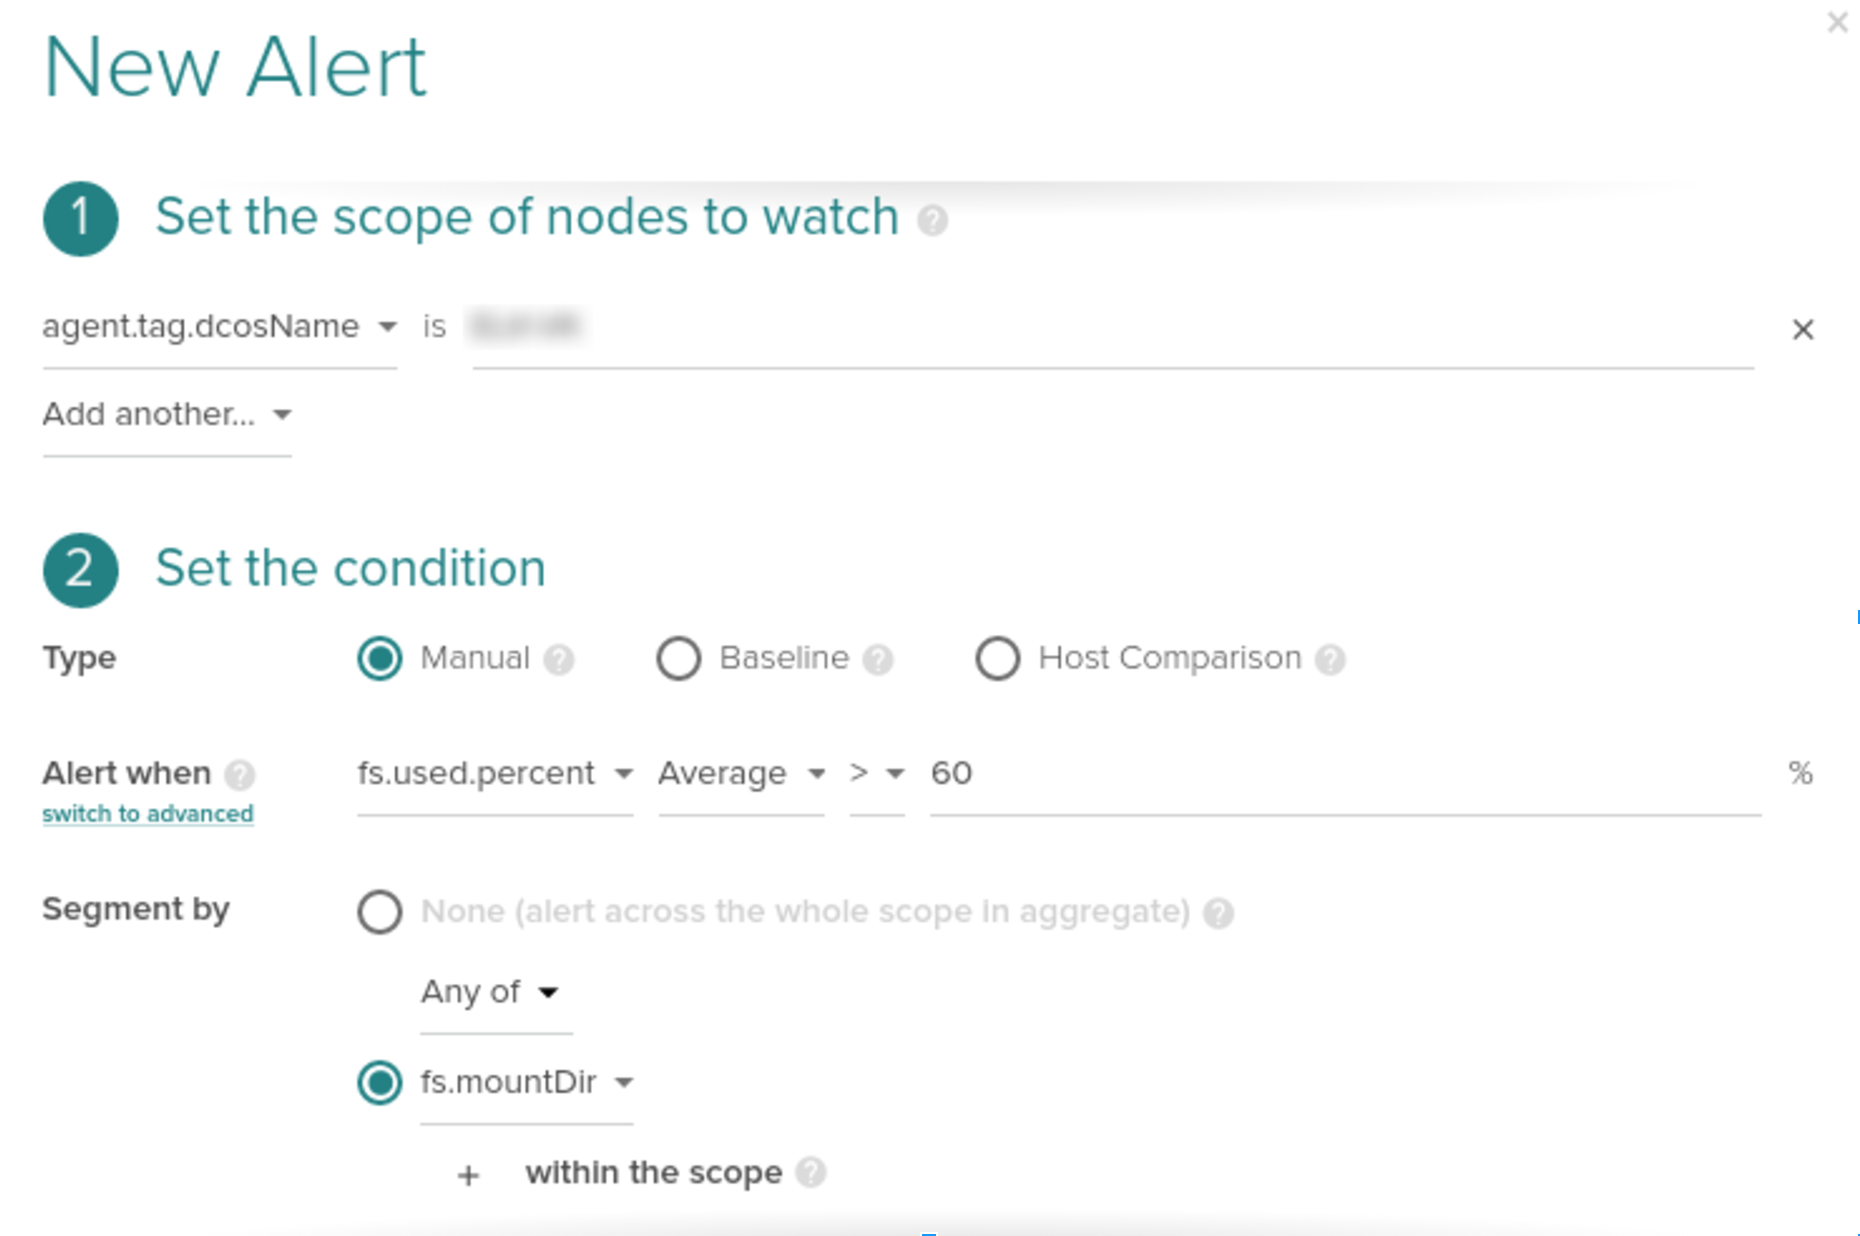
Creating an alert for 60% disk utilization
\r\r
The following steps will help you to create an alert when the root directory (/) exceeds 60% of its usage:
\r\r
- \r
- Under alert tab click add alert button \r
- Select the scope as
agent.tag.dcosNameorregion.agent.tag.dcosNameIs the tag we have added for the dcos cluster.regionspecify the aws region name. Assign the value for scope from the dropdown accordingly which one you selected as the scope. \r - Under
Set the conditionchoose type asmanual\r - For
Alert whenoption Choosefs.used.percentas the metric > 60% as the threshold value. \r - For
Segment bychoose second option, selectAny ofandfs.mountDirmetric.
- \r
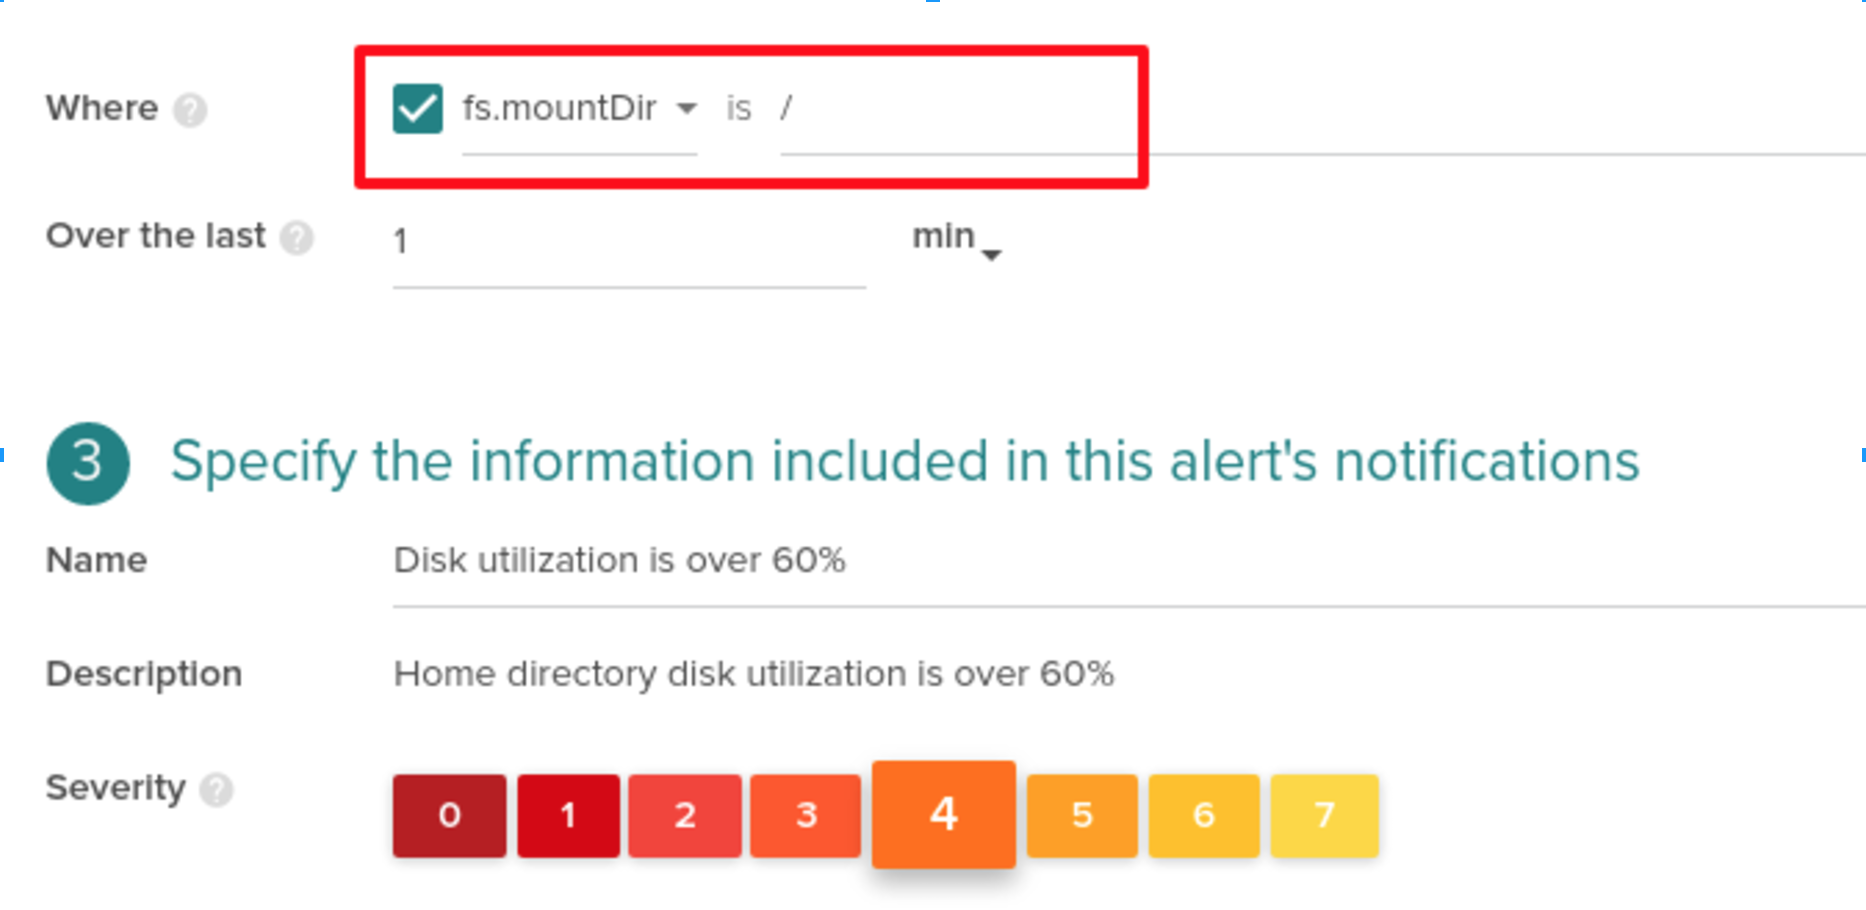
- Check the
Whereoption and selectfs.mountDirfrom the dropdown. Assign the value/
- \r
- Choose the minimum monitor value as
1 min. \r - Specify the Name, Description and Severity of the alert. \r
- Enable the notification channel. \r
- Enable automatic sysdig capture if necessary. \r
- Click Create button. \r
\r\r
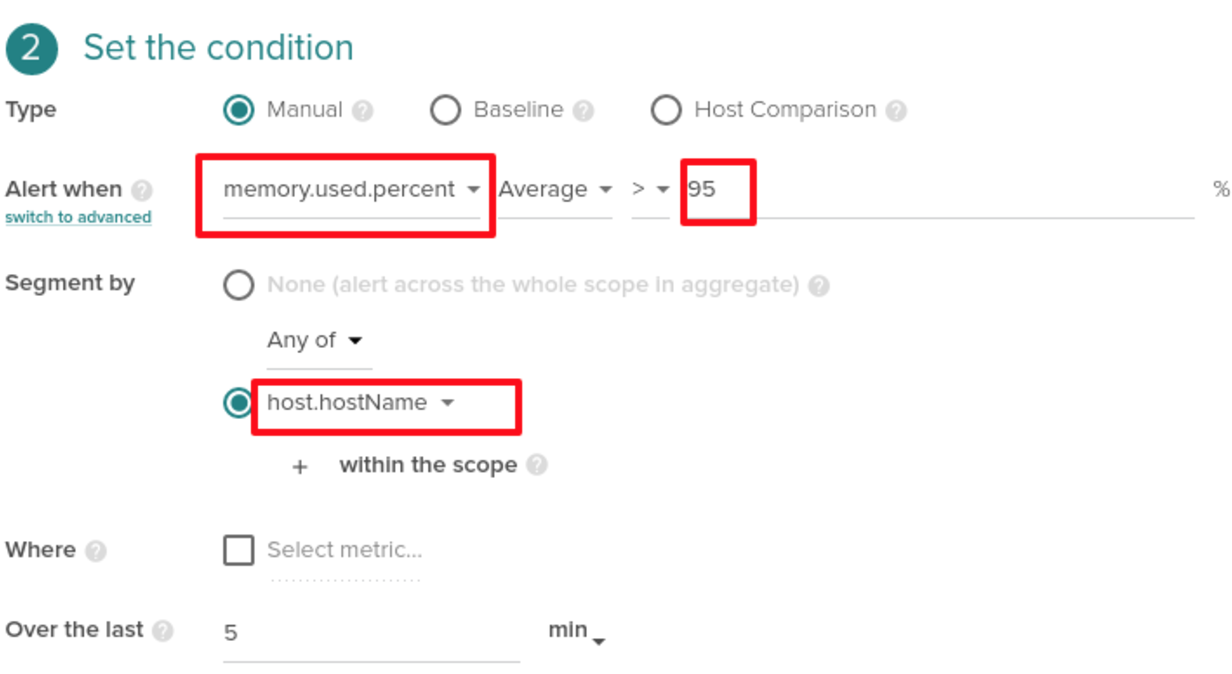
Creating an alert for 95% CPU utilization
\r\r
The following steps will help you to create an alert when a node exceeds 90% of its memory utilization.
\r\r
- \r
- Under alert tab click add alert button \r
- Select the scope as
agent.tag.dcosNameorregion.agent.tag.dcosNameIs the tag we have added for the dcos cluster.regionspecify the aws region name. Assign the value for scope from the drop down accordingly which one you selected as the scope. \r - Under
Set the conditionchoose type asmanual\r - For
Alert whenoption Choosememory.used.percentas the metric > 95% as the threshold value. \r - For
Segment bychoose second option, selectAny ofandhost.hostNamemetric. \r - Leave the
Whereoption unchecked. \r - Choose the minimum monitor value as
5 min. \r - Specify the Name, Description and Severity of the alert. \r
- Enable the notification channel. \r
- Enable automatic sysdig capture if necessary. \r
- Click Create button.
- \r
\r\r
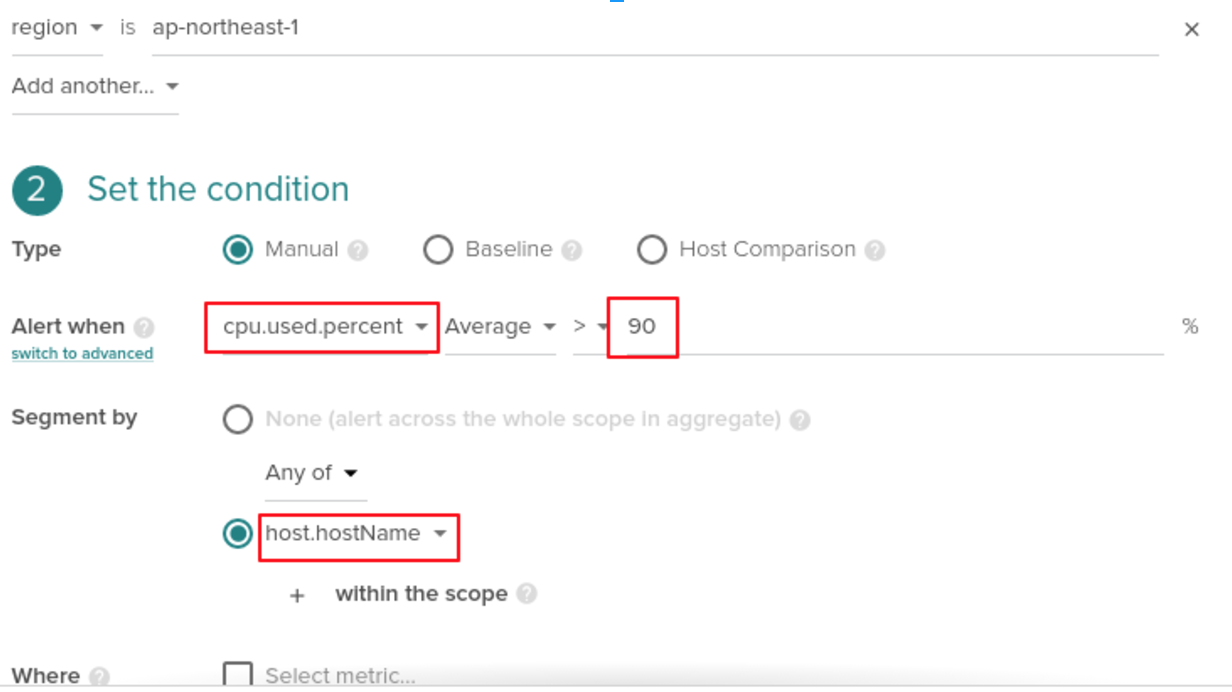
Creating an alert for 90% CPU utilization
\r\r
The following steps will help you to create an alert when a node exceeds 90% of its cpu utilization:
\r\r
- \r
- Under alert tab click add alert button. \r
- Select the scope as
agent.tag.dcosNameorregion.agent.tag.dcosNameIs the tag we have added for the dcos cluster.regionspecify the aws region name. Assign the value for scope from the drop down accordingly which one you selected as the scope. \r - Under
Set the conditionchoose type asmanual\r - For
Alert whenoption Choosecpu.used.percentas the metric > 90% as the threshold value. \r - For
Segment bychoose second option, selectAny ofandhost.hostNamemetric. \r - Leave the
Whereoption unchecked. \r - Choose the minimum monitor value as
5 min. \r - Specify the Name, Description and Severity of the alert. \r
- Enable the notification channel. \r
- Enable automatic sysdig capture if necessary. \r
- Click Create button. \r
\r\r
featured resources