


Falco Feeds extends the power of Falco by giving open source-focused companies access to expert-written rules that are continuously updated as new threats are discovered.

Fluentd is an open source data collector widely used for log aggregation in Kubernetes. Monitoring and troubleshooting Fluentd with Prometheus is really important to identify potential issues affecting your logging and monitoring systems.\r
\rIn this article, you'll learn how to start monitoring Fluentd with Prometheus, following Fluentd docs monitoring recommendations. You'll also discover the most common Fluentd issues and how to troubleshoot them.\r
\r\r\r
How to install and configure Fluentd to expose Prometheus metrics
\r
\rYou can install Fluentd in different ways, as seen in Fluentd documentation. We recommend deploying Fluentd in Kubernetes by using the Helm chart:\r
\rhelm repo add fluent https://fluent.github.io/helm-charts\r
helm repo update\r
helm install fluentd fluent/fluentd\r
\rYou'll need to enable a few Fluentd Prometheus plugins for Fluentd to expose metrics. But don't worry, they are already activated in the Helm chart, so if you installed Fluentd that way, you're good to go.\r
\r\r\r
Monitoring Fluentd with Prometheus: Inputs
\r\r\r
Incoming records
\r
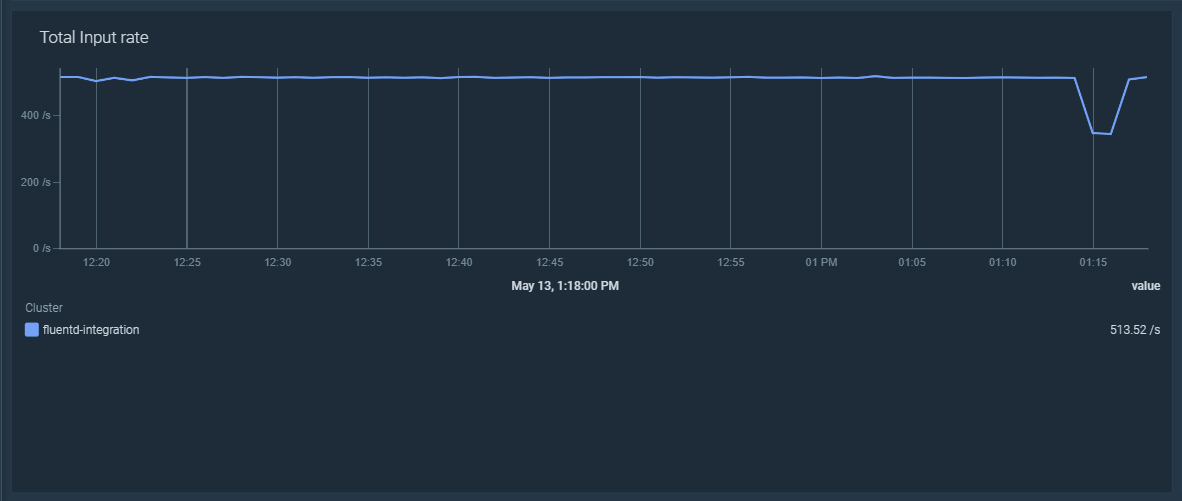
\rFluentd can collect data from many sources. Each piece of data (e.g., an entry of a log) is a record, and Fluentd exposes the fluentd_input_status_num_records_total metric, which counts the total number of records collected from each source.\r
\r
\rYou can use the following PromQL query in your dashboard to display the rate of incoming records in all of your Fluentd instances:\r
\rsum(rate(fluentd_input_status_num_records_total[5m]))\r\r
\r\r
Relabelling the 'tag' label for better filtering
\r
\rThe metric fluentd_input_status_num_records_total has a label called tag that contains the source of the record, usually a path to a log file inside the node. The problem is that in Kubernetes, these file names tend to have names that concatenate several strings, like the pod name, the container, and the namespace. To leverage this, let's see how to use Prometheus metric relabelling.\r
\r
\rHere, you can find an example of Fluentd collecting logs from a CoreDNS pod in Kubernetes:\r
\rfluentd_input_status_num_records_total{tag="kubernetes.var.log.containers.coredns-56dd667f7c-p9vbx_kube-system_coredns-72d2ba9bae8f73e32b3da0441fbd7015638117e37278d076a6f99c31b289e404.log",hostname="fluentd-lks8v"} 4.0\r
\rIn the Prometheus job, you can use metric relabelling to create new labels from other ones. In this case, you can use a regular expression to create new labels for the namespace, the pod name, and the container:\r
\rmetric_relabel_configs:\r
- action: replace\r
source_labels:\r
- __name__\r
- tag\r
regex: fluentd_input_status_num_records_total;kubernetes.var.log.containers.([a-zA-Z0-9 d.-]+)_([a-zA-Z0-9 d.-]+)_([a-zA-Z0-9 d.-]+)-[a-zA-Z0-9]+.log\r
target_label: input_pod\r
replacement: $1\r
- action: replace\r
source_labels:\r
- __name__\r
- tag\r
regex: fluentd_input_status_num_records_total;kubernetes.var.log.containers.([a-zA-Z0-9 d.-]+)_([a-zA-Z0-9 d.-]+)_([a-zA-Z0-9 d.-]+)-[a-zA-Z0-9]+.log\r
target_label: input_namespace\r
replacement: $2\r
- action: replace\r
source_labels:\r
- __name__\r
- tag\r
regex: fluentd_input_status_num_records_total;kubernetes.var.log.containers.([a-zA-Z0-9 d.-]+)_([a-zA-Z0-9 d.-]+)_([a-zA-Z0-9 d.-]+)-[a-zA-Z0-9]+.log\r
target_label: input_container\r
replacement: $3\r
\rAfter applying the relabelling magic, the previous Fluentd example metrics from CoreDNS would look like this:\r
\rfluentd_input_status_num_records_total{input_pod="coredns-56dd667f7c-p9vbx",input_container="coredns",input_namespace="kube-system",tag="kubernetes.var.log.containers.coredns-56dd667f7c-p9vbx_kube-system_coredns-72d2ba9bae8f73e32b3da0441fbd7015638117e37278d076a6f99c31b289e404.log",hostname="fluentd-lks8v"} 4.0\r
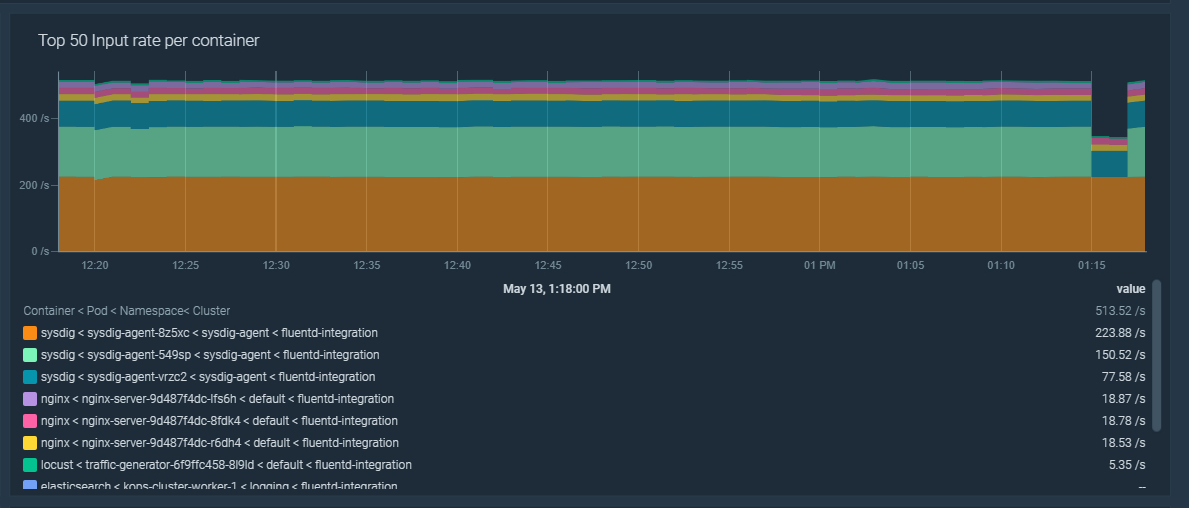
\rYou can use these new labels to filter the rate of incoming records by namespace, pod, or container. This is quite handy when creating dashboards.\r
\rsum by (input_namespace, input_pod, input_container)(rate(fluentd_input_status_num_records_total[5m]))\r\r
\r\r
Monitoring Fluentd with Prometheus: Outputs
\r\r\r
Outgoing records
\r
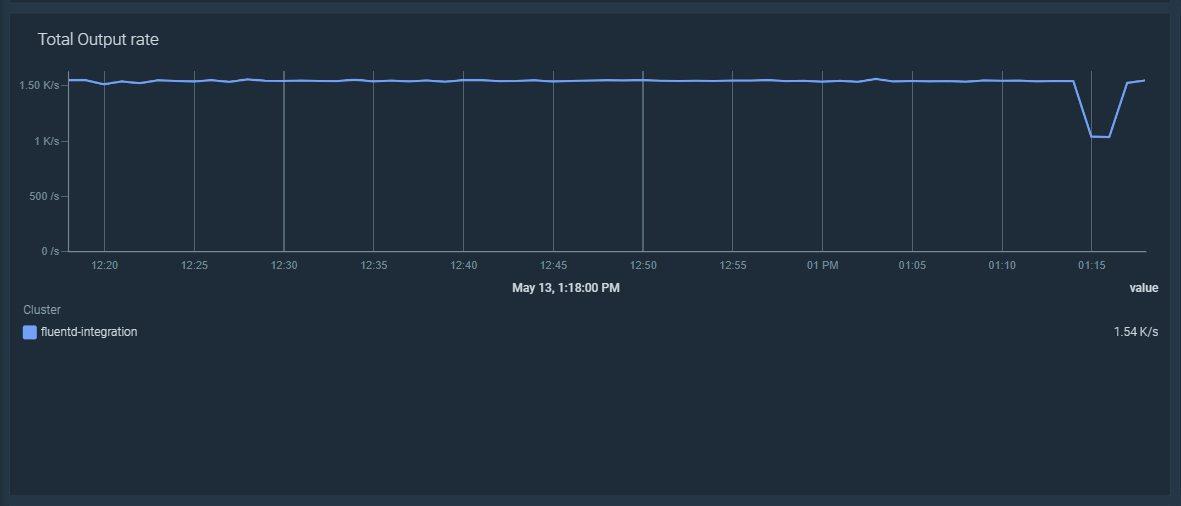
\rFluentd can emit the previously collected incoming records to different destinations by using multiple output plugins types. This is also known as flush. The emitted records are counted by the fluentd_output_status_emit_records metric.\r
\r
\rYou can use the following PromQL query in your dashboard to display the rate of emitted records in all of your Fluentd instances:\r
\rsum(rate(fluentd_output_status_emit_records[5m]))\r
\r
\r\r
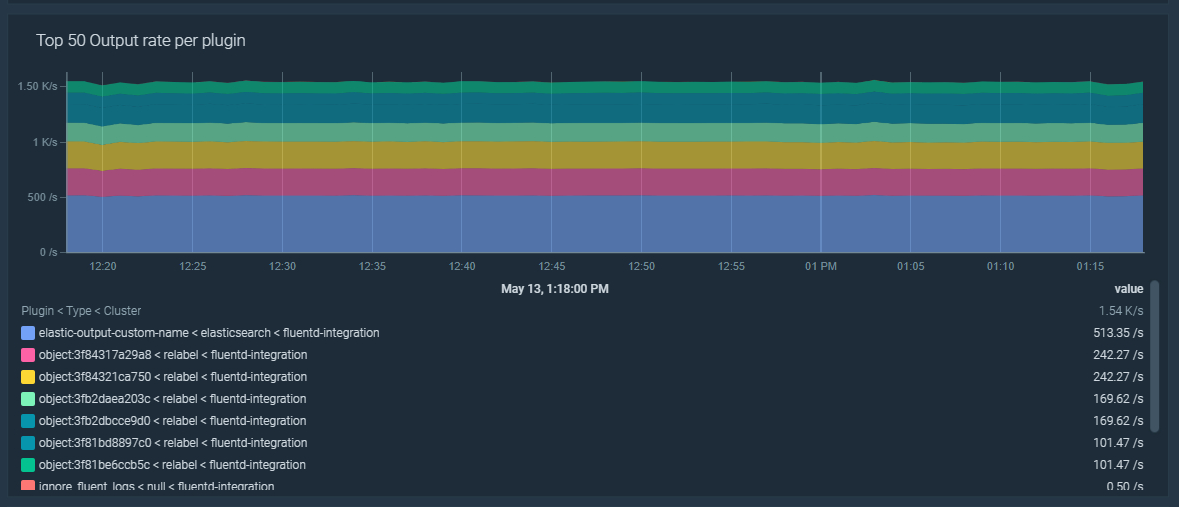
\rAll Fluentd metrics starting with fluentd_output_ include the following labels:\r
\r
- \r
- type, for the output plugin type.\r
- plugin_id, the custom plugin id in your configuration, or a random id if not specified.\r \r
\r
\rYou can also use these labels for better filtering in your dashboard:\r
\rsum by (type, plugin_id)(rate(fluentd_output_status_emit_records[5m]))\r
\r
\r\r\r
Top troubleshooting situations to monitor Fluentd
\r\r\r
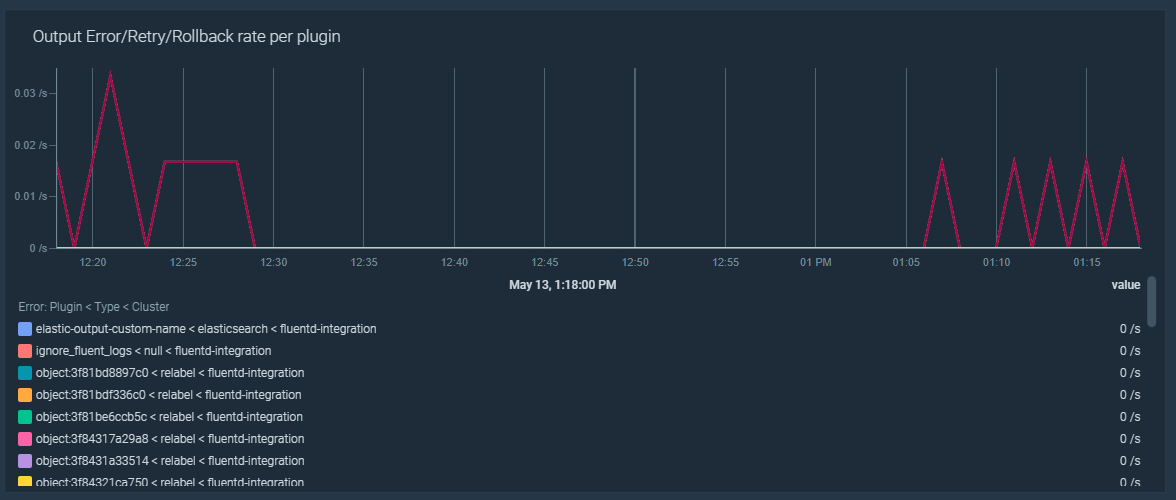
Troubleshooting errors, retries, and rollbacks in Fluentd
\r
\rFluentd can face issues when trying to flush records to its configured output destinations. These issues, permanent or temporal, might include networking issues or even the destination system being down.\r
\r
\rLet's create an alert to trigger if Fluentd has a flush error ratio higher than 5%:\r
\r100 * sum by (type, plugin_id)(rate(fluentd_output_status_num_errors[5m])) / sum by (type, plugin_id)(rate(fluentd_output_status_emit_count[5m])) > 5\r
\rYou could create similar alerts for retries or rollbacks. Although the alert for errors should be enough to detect the issue, these new ones help you to identify the cause. Those alerts look like this:\r
\r100 * sum by (type, plugin_id)(rate(fluentd_output_status_retry_count[5m])) / sum by (type, plugin_id)(rate(fluentd_output_status_emit_count[5m])) > 5\r100 * sum by (type, plugin_id)(rate(fluentd_output_status_rollback_count[5m])) / sum by (type, plugin_id)(rate(fluentd_output_status_emit_count[5m])) > 5\r
\r
\r
\rWhen Fluentd fails to flush, it waits a few seconds before retrying. Each time it retries, this waiting time increases. Once the maximum wait time is reached, Fluentd discards the data that needs to be flushed, so it's lost. Let's create an alert that triggers if the retry wait time is over 60 seconds:\r
\rsum by (type, plugin_id)(max_over_time(fluentd_output_status_retry_wait[5m])) > 60\r\r\r
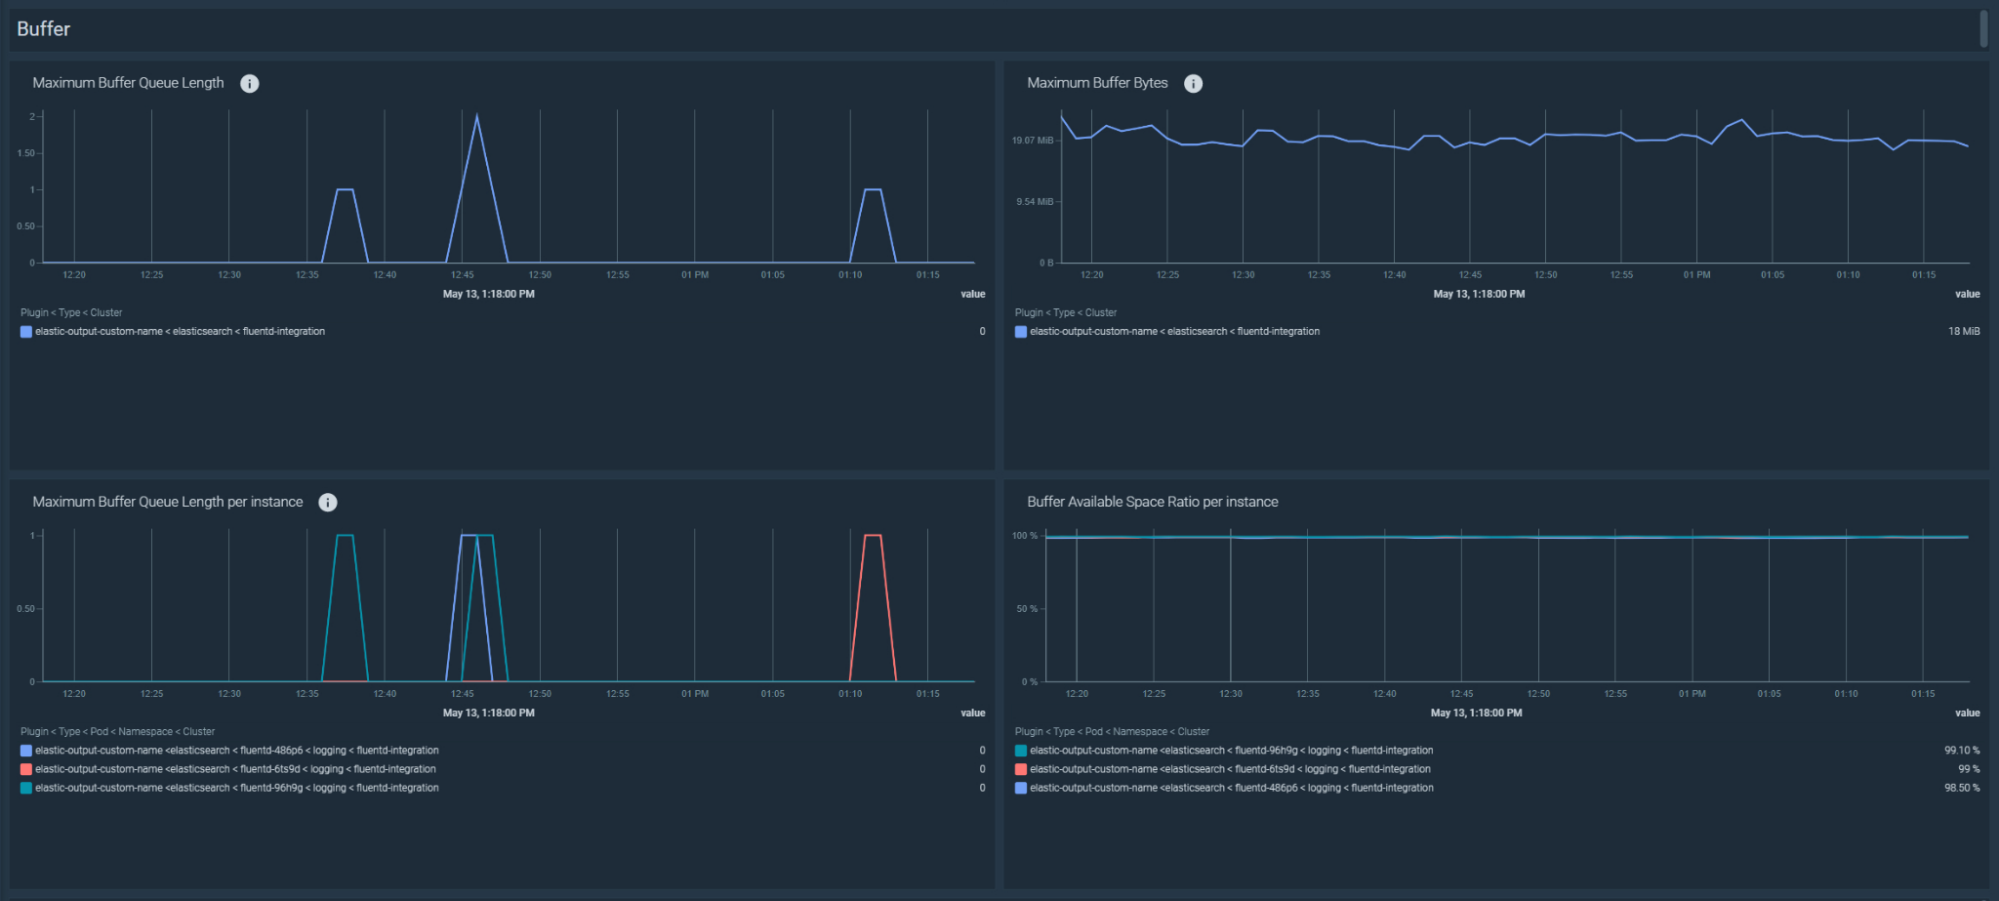
Troubleshooting buffer queue not being flushed in Fluentd
\r
\rFluentd stores the collected records in a buffer and then flushes them to its configured output destinations. When Fluentd fails to flush them, the buffer size and queue length increases. Consequently, you will lose the data once the buffer becomes full.\r
\r
\rThese are the recommended alerts for the buffer capacity:\r
\r\r\r
Low buffer available space
\r
\rFluentd buffer available space is lower than 10%:\r
\rfluentd_output_status_buffer_available_space_ratio < 10\r\r\r
Buffer queue length increasing
\r
\rThe queued records have increased in the last five minutes:\r
\ravg_over_time(fluentd_output_status_buffer_queue_length[5m]) - avg_over_time(fluentd_output_status_buffer_queue_length[5m] offset 5m) > 0\r\r\r
Buffer total bytes increasing
\r
\rThe buffer size has increased in the last five minutes:\r
\ravg_over_time(fluentd_output_status_buffer_total_bytes[5m]) - avg_over_time(fluentd_output_status_buffer_total_bytes[5m] offset 5m) > 0\r
\r
\r\r\r
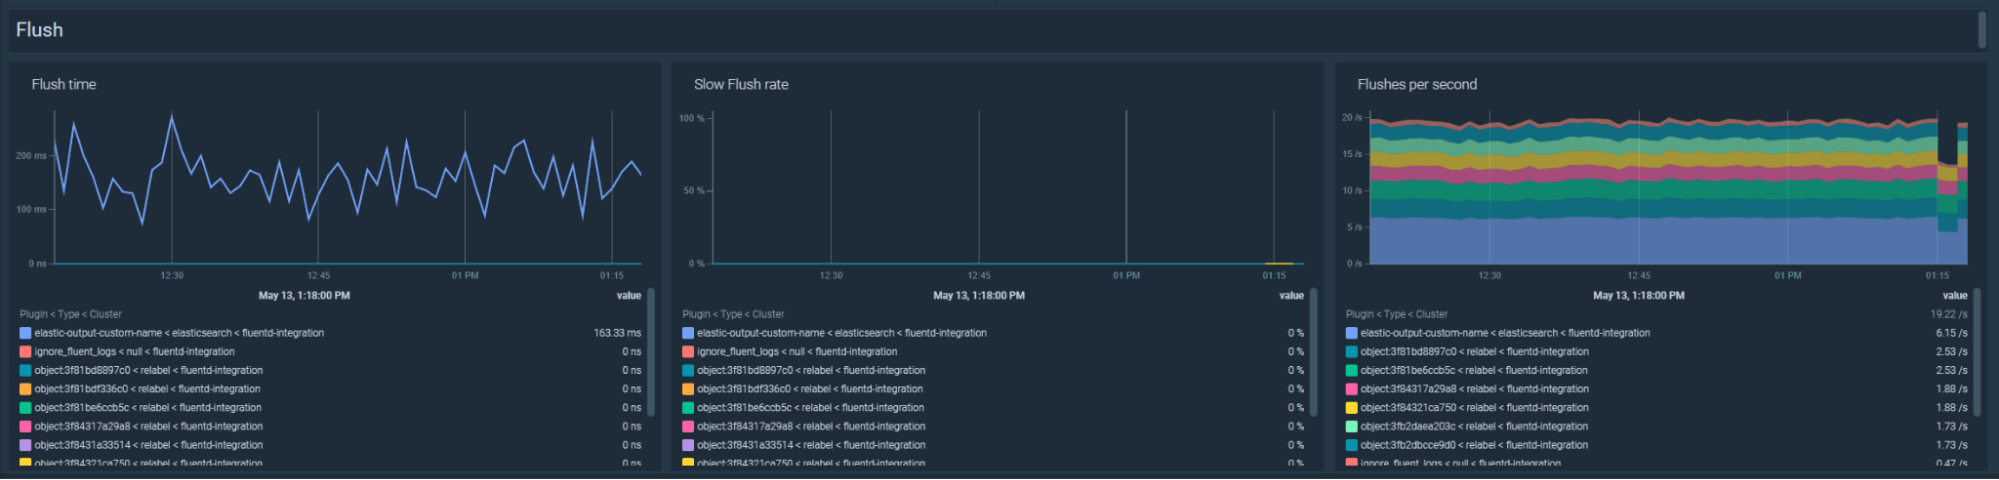
Troubleshooting slow flushes in Fluentd
\r
\rIf Fluentd flushes take too much time, it can also be an indicator of network issues or problems in the destination systems. Let's create an alert to trigger if Fluentd has a slow flush ratio over 5%:\r
\r100 * sum by (type, plugin_id)(rate(fluentd_output_status_slow_flush_count[5m])) / sum by (type, plugin_id)(rate(fluentd_output_status_emit_count[5m])) > 5\r
\rIn your dashboard, you can troubleshoot the flush time with the following PromQL:\r
\rsum by(kube_cluster_name, type, plugin_id)(rate(fluentd_output_status_flush_time_count[5m]))\r
\rYou can also see if the amount of flushes per second have increased or decreased by using the following PromQL:\r
\rsum by(kube_cluster_name, type, plugin_id)(rate(fluentd_output_status_emit_count[5m]))\r
\r
\r\r\r
Troubleshooting Fluentd stopped flushing
\r
\rFluentd didn't flush any records in the last five minutes:\r
\rrate(fluentd_output_status_emit_records[5m]) == 0\r\r\r
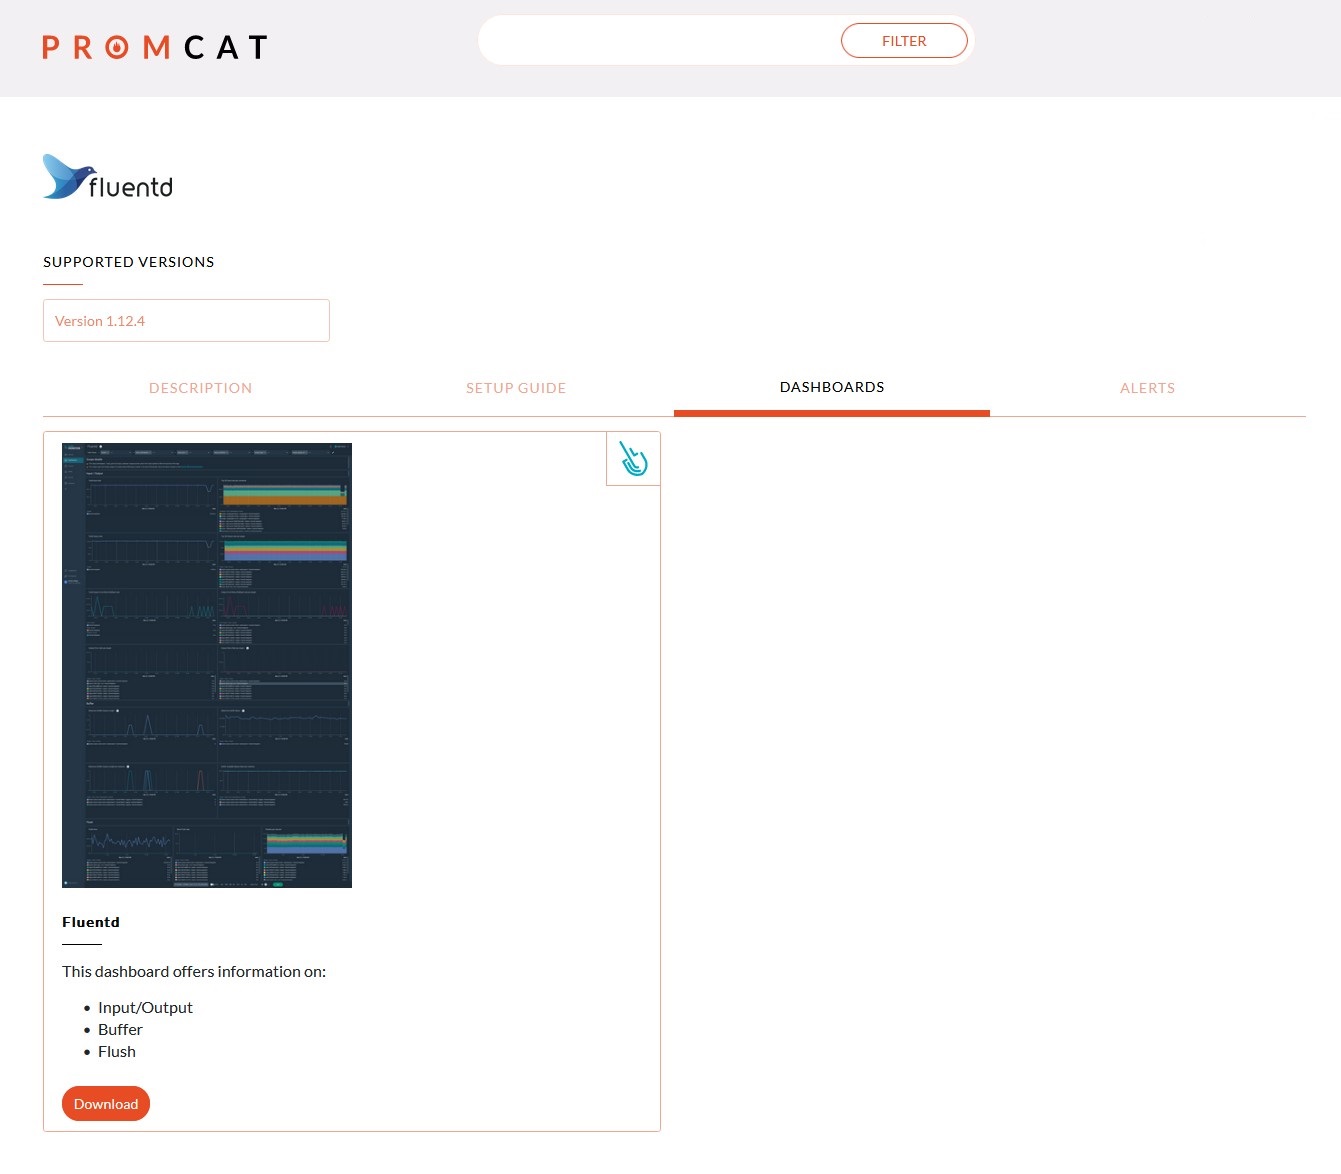
Monitor Fluentd with Prometheus, with these dashboards
\r
\r
\r
\r
\rDon't miss these open source dashboards to monitor your Fluentd application. They are already set up, so you can use them right away!, They include:\r
\r
- \r
- Input/Output\r
- Buffer\r
- Flush\r\r\r\r\rWant to try this integration?\r
- \rRegister now for the free Sysdig Monitor trial and start taking advantage of its Managed Prometheus service. Try our Prometheus integrations or send metrics through Prometheus Remote Write in minutes!\r
- \r\r