


Falco Feeds extends the power of Falco by giving open source-focused companies access to expert-written rules that are continuously updated as new threats are discovered.

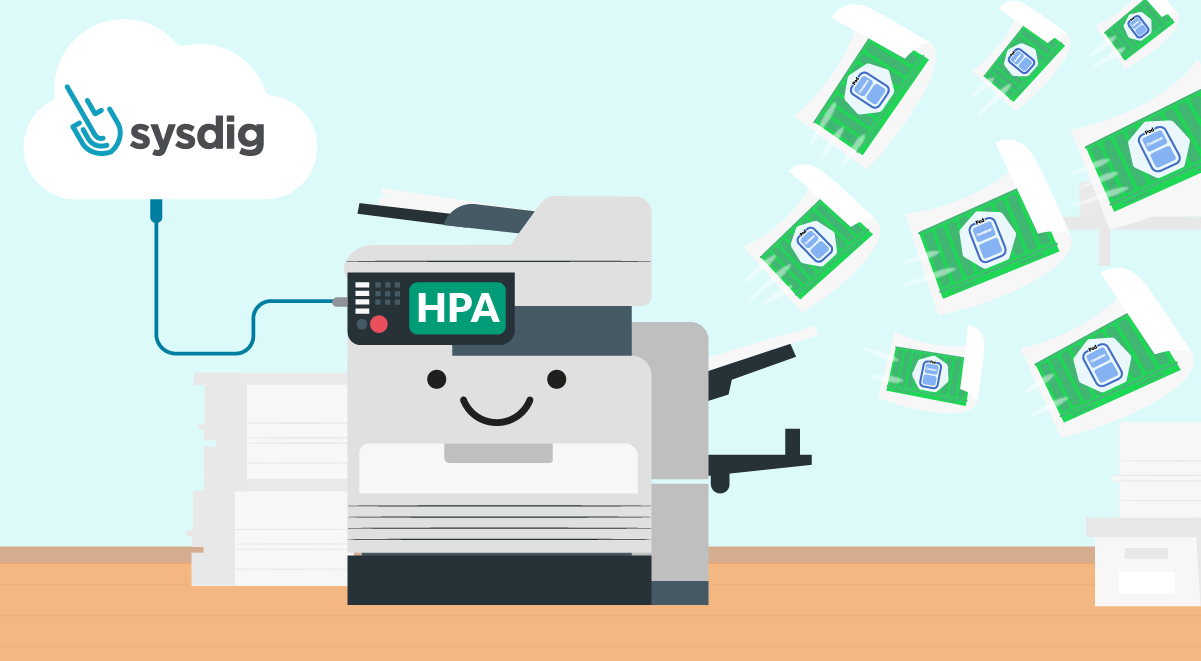
In this article, you'll learn, through an example, how to configure Keda to deploy a Kubernetes Horizontal Pod Autoscaler (HPA) that uses Sysdig Monitor metrics.
Keda is an open source project that allows using Prometheus queries to scale Kubernetes pods.
In Trigger a Kubernetes HPA with Prometheus metrics, you learned how to install and configure Keda to create a Kubernetes HPA triggered by a standard Prometheus query.
Now it's time to take advantage of Sysdig's managed Prometheus solution, which automatically enriches your metrics with your Kubernetes and application context.
Sysdig Monitor is fully compatible with Prometheus queries (PromQL) and has a secure Prometheus endpoint that can be configured as ServerAddress for your Keda Prometheus trigger.
Scenario
You have an Nginx deployment deployed on your cluster. You want it to scale from 1 to 5 replicas, based on the nginx_connections_waiting metric from the Nginx exporter. If there are more than 500 waiting connections, then you want to schedule a new pod.
Let's create the query to trigger the HPA with Keda and Sysdig
sum((nginx_connections_waiting{kube_cluster_name="demo-env-prom", kube_namespace_name="keda-hpa", kube_workload_name="nginx-server"})Code language: JavaScript (javascript)Easy, right? This query just returns the sum of the nginx_connections_waiting metric value for the demo-env-prom cluster, keda-hpa namespace, and nginx-server workload.
Managing authentication
You just need to create a secret with your Sysdig API Token.
kubectl create secret generic keda-prom-secret --from-literal=bearerToken=API_KEY> -n kedaCode language: JavaScript (javascript)And create a TriggerAuthentication object.
apiVersion: keda.sh/v1alpha1
kind: TriggerAuthentication
metadata:
 name: keda-prom-creds
spec:
 secretTargetRef:
 - parameter: bearerToken
   name: keda-prom-secret
   key: bearerTokenCode language: YAML (yaml)
Finally, you just need to create and apply the ScaledObject.
apiVersion: keda.sh/v1alpha1
kind: ScaledObject
metadata:
 name: nginx-scale
 namespace: keda-hpa
spec:
 scaleTargetRef:
   kind: Deployment
   name: nginx-server
 minReplicaCount: 1
 maxReplicaCount: 5
 cooldownPeriod: 30
 pollingInterval: 1
 triggers:
 - type: prometheus
   metadata:
     serverAddress: https://app.sysdigcloud.com/prometheus
     metricName: nginx_connections_waiting_keda
     query: |
      sum((nginx_connections_waiting{kube_cluster_name="demo-env-prom", kube_namespace_name="keda-hpa", kube_workload_name="nginx-server"})
     threshold: "20"
     authModes: "bearer"
   authenticationRef:
     name: keda-prom-credsCode language: YAML (yaml)
Notice the metricName parameter. This is a custom name you set for receiving the value from the query. Keda gets the result of the query and creates the nginx_connections_waiting_keda metric with it. Then, it uses this metric to trigger the escalation.
Easy peasy
In this article, you learned how easy it is to deploy an HPA with Keda that is triggered by metrics from Sysdig Monitor. Don't have an account yet? Sign up for a free trial now!