


Falco Feeds extends the power of Falco by giving open source-focused companies access to expert-written rules that are continuously updated as new threats are discovered.

Observability is the key to solving problems quickly, and organizations use many tools to try to increase visibility in their environments so they don't miss anything. Typical sources of observability include metrics, logs, and traces.
Metrics
The foundation of monitoring, metrics are predictable counts or measurements that are aggregated over a specific period of time.
Logs
Timestamped records of discrete events that can store outputs from applications, systems, and services. They provide insight into what changed in the system's behavior when things went wrong.
Traces
Information about a transaction or request from an application or system. A single trace displays the operation as it moves from one node to another in a distributed system.
At Sysdig, we specialize in gathering metrics, especially in hard-to-monitor environments like Kubernetes, while being compatible with Prometheus. However, understanding the correlation between logs and metrics can help organizations mitigate issues quickly while gaining a more complete picture of their infrastructure's health.
With that in mind, Sysdig and LogDNA have collaborated on a new integration that allows users to introduce log events from LogDNA into Sysdig, letting you see them alongside your other events for faster correlation.
Here is how it works
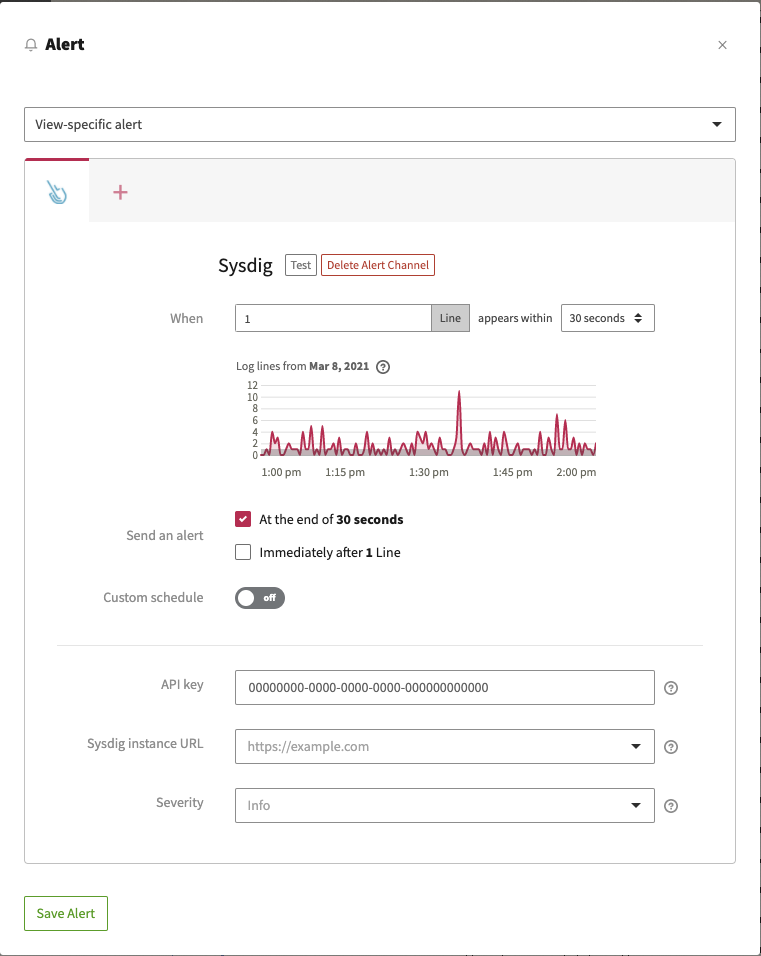
LogDNA users will create a preset or view-specific Sysdig alert in LogDNA, where you can define the parameters for the alert. These might include whether it is a presence or absence alert, how many lines of log data are alerted on, and the time period for when the alert should occur. If this is the first alert you have set up, you will then be asked to connect to your Sysdig account.
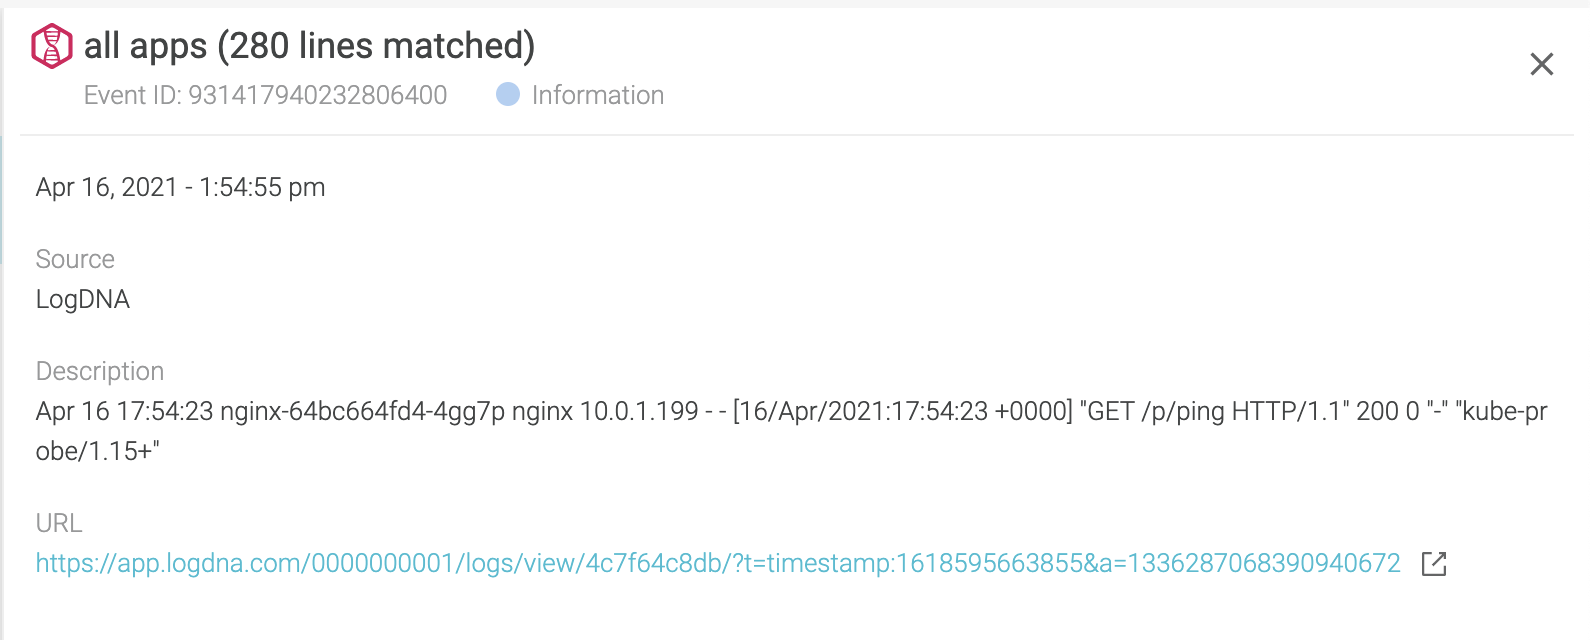
In Sysdig Monitor, you will see LogDNA events show up in the event timeline along with your other events. These events will show the name of the LogDNA alert, the number of lines matched, and provide a URL to direct you back to the specific alert details in LogDNA.
Having this increased visibility is just another way that organizations can solve problems faster by having more information at their fingertips. You can try this integration today by opening up the Alerts panel in your LogDNA account. You can also read more about the integration in this LogDNA press release.