


Falco Feeds extends the power of Falco by giving open source-focused companies access to expert-written rules that are continuously updated as new threats are discovered.

Metrics monitoring is incredibly powerful, but only if you know what those metrics actually mean! To make it simpler on everyone we've introduced a Metrics Dictionary into our application and our support material. It's perfect for new members of your team or for folks who may not use monitoring data frequently enough to know your metrics by heart.
\r\r
The Metrics Dictionary gives you a list of all the default metrics we collect by default, as well as a short description of what the metric actually means. (Sorry we can't automatically interpret what your statsd or JMX metrics mean!) The information is accessible in two ways:
\r\r
- \r
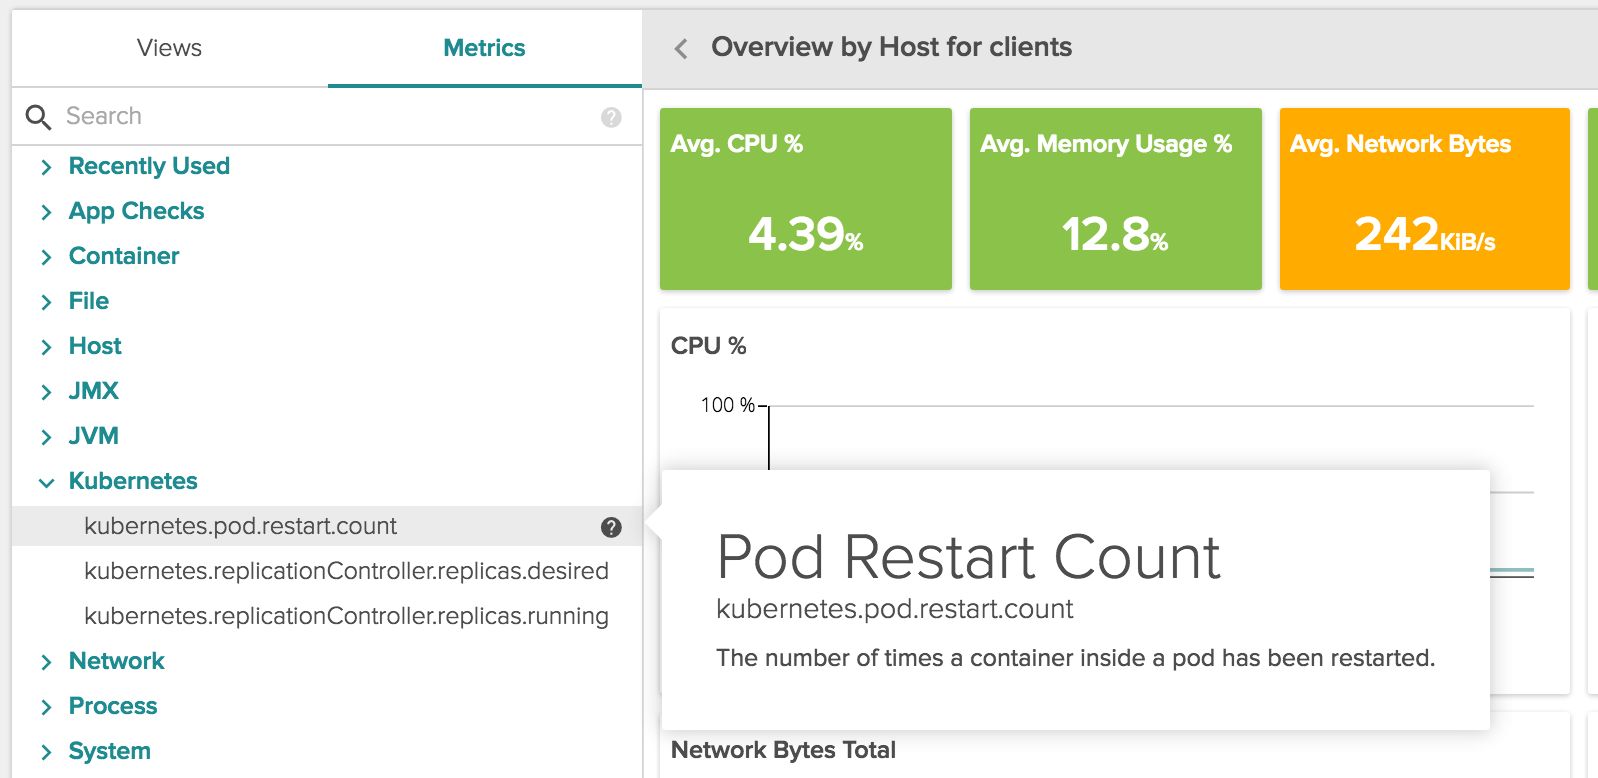
- In the application. If you select a particular metric, you'll see a question mark to the right. Simply hovering over that icon gives you the metric definition:
- \r
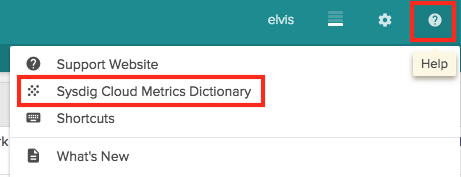
- In our documentation. Sometimes it's easier to browse a list versus looking at an individual definition, especially if you're looking for the 'right' metric. We've published the dictionary in our documentation and made it easily accessible within the application.
- \r\r
- Just choose the help question mark in the top right and you'll see the Cloud Metrics Dictionary. Selecting it opens an additional tab. \r
\r\r
\r\r
The Metrics Dictionary is available immediately and we'll continue to update it as we add new metrics. Enjoy!