


Falco Feeds extends the power of Falco by giving open source-focused companies access to expert-written rules that are continuously updated as new threats are discovered.

Sysdig tracers let you track and measure spans of execution in a distributed software system. You can instrument almost anything with a sysdig tracer – a method in your software, a service call, a network request, a shell command execution, a script, and any other thing that can happen in a computer system.Once you instrument something with sysdig tracers, you can monitor how long it takes to complete, you can observe the system activity taking place within a span, or you can trace how it progresses through your system.Tracers were designed to be efficient, extremely easy to use, leverageable from everywhere (inside and outside your source code) and container friendly.
- Tracers are a feature on top of sysdig, the open source linux system visibility tool. If you're not familiar with sysdig, read this quick overview when you get a chance.*
A Simple Example
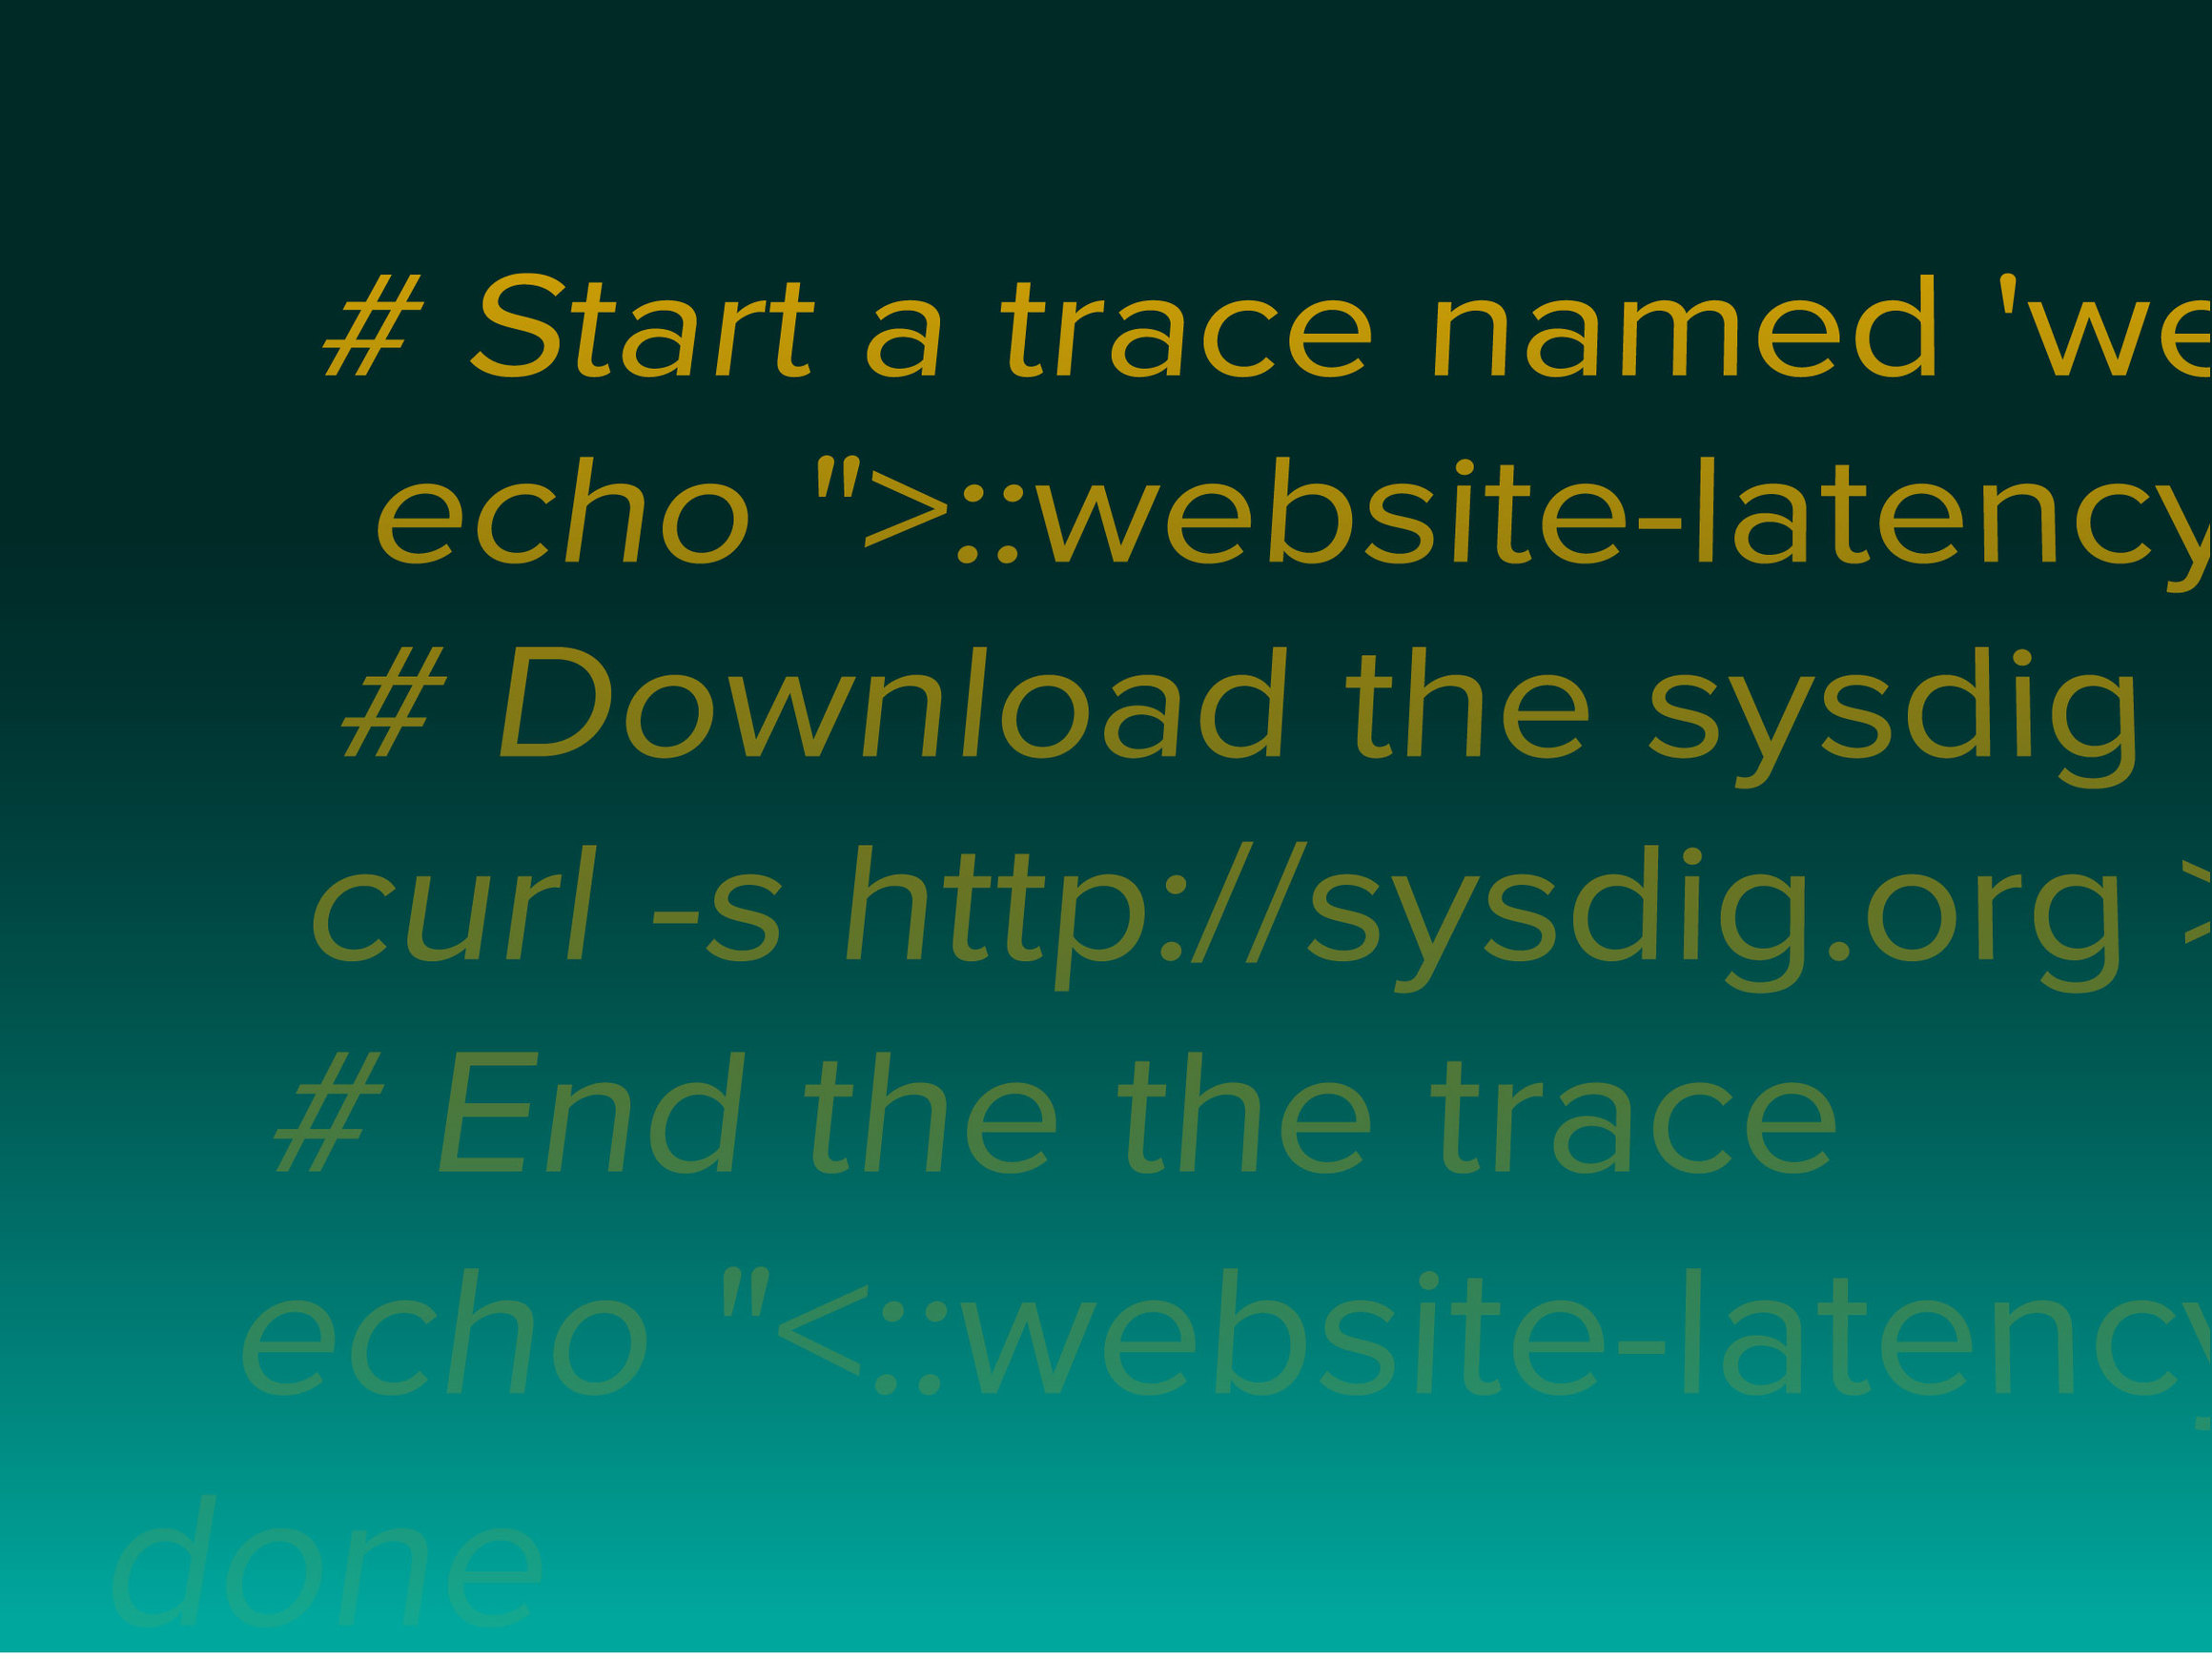
Tracers are easy and so language independent that you can even trace what happens in a shell script, with just two additional lines:
#!/bin/bash
#
# A simple shell script that measures the time to download the sysdig home page
#
while :
do
    # Start a trace named 'website-latency'
    echo ">::website-latency::" > /dev/null
    # Download the sysdig home page
    curl -s http://sysdig.org > /dev/null
    # End the the trace
    echo "<::website-latency::" > /dev/null
donesudo csysdig -v spectro_tracersAnd you will get a nice visualization of the trace latency:
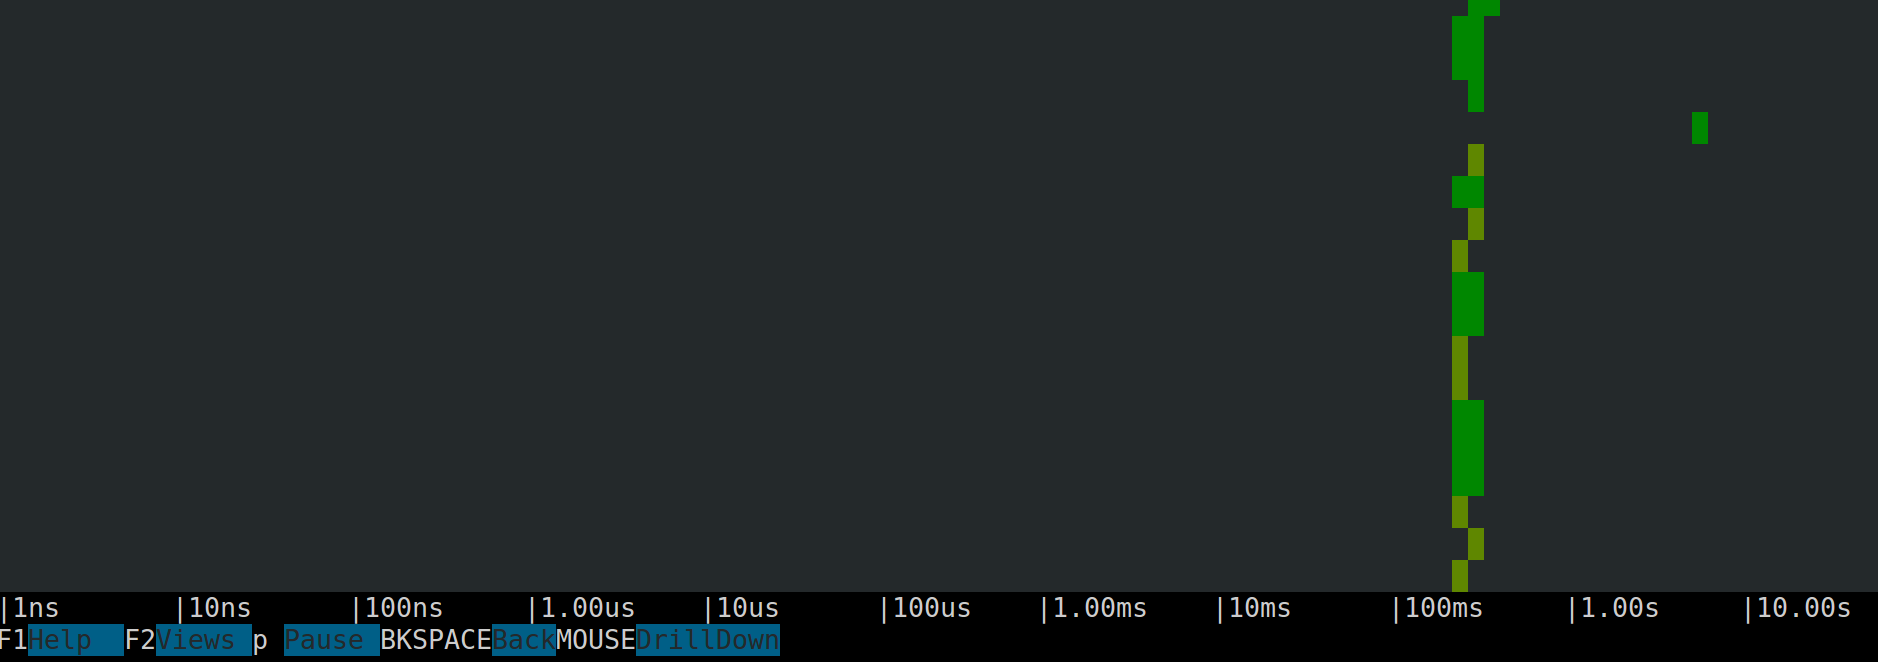
This is, of course, just one example of the many things that sysdig tracers let you do, but I hope it whets your appetite. Let's keep going.
How Sysdig Trace Collection Works
A tracer is a marker for a point in time in execution. Tracers always come in pairs: an entry tracer, which delimits the beginning of a span, and a corresponding exit tracer, which closes the span. A span, therefore, is the interval of execution delimited by two corresponding tracers. Spans can be nested, which means that a span can contain layers of other spans. The root of a span tree is called a trace.Now here's the cool part: tracers are created by writing specially formatted text strings to /dev/null. If you can write to /dev/null, you can emit a tracer! No library to link. No application framework to instrument. Sysdig automatically captures these strings before they are discarded, then parses them and converts them into special tracer events that become part of the sysdig events stream. This means that it's easy to do typical sysdig things like: save them to a capture file, search them using filters, manipulate them using chisels, and visualize them in csysdig (the curses-based command line UI for sysdig).It's worth noting, emitting tracers is reasonably efficient: on an average machine, you can expect the overhead to be under one microsecond.Tracers, and therefore spans, also carry additional state that makes them useful for tracing: they have properties like an ID, one or more tags, and an arbitrary number of arguments. You can get the full details in the tracers manual in the wiki. First, however, let's talk about the motivation behind this…
Why Sysdig tracers? A manifesto
The more powerful and sophisticated our software becomes, the more important it is to measure its performance.At the present day, people interested in measuring things have access to two main categories of tools:
- Some great, established standards for basic metrics collection (e.g. SNMP, StatsD, CollectD)
- Application Performance Management (APM) tools that help identify bottlenecks in distributed application. This includes a bunch of expensive commercial tools and a handful nascent community efforts (e.g. opentracing, zipkin, X-Trace)
StatsD and CollectD are absolutely great, but we often need to export more than just "numbers". For example, it's often helpful to understand bottlenecks, component interactions and delays without having to worry about the collection complexities. APM solutions address this problem, but are either expensive, or very hard to deploy, or tied to specific languages/frameworks, or all of the above. For this reason, APM is often relegated to a small slice of an environment, where the cost is justified.Sysdig tracers are a compromise between these two approaches: think about them as a simplified APM that is always available, lightweight and free. Tracers are nestable and based on absolute IDs, so they work well both in single machine and distributed setups, and this makes them effective not only in production, but during development too, especially when using containers.Application transaction time, by the way, is a very important thing to track, but there are so many more things that are useful to measure:
- system-level latencies
- batch jobs duration
- deployments interruption times
- autoscaling latencies
- container startup times.
Sysdig tracers make it possible to easily trace all these things, and many more.But what I find really exciting is how many new cool things we can do when tracing meets sysdig.Let me give you some examples.
Some Useful Things You Can Do With Sysdig Tracers
Treat tracers as sysdig events
As mentioned, the tracers that you emit simply become events in the sysdig event stream. As a consequence, the whole sysdig goodness is at your disposal when working with tracers. For example, you can store your tracers in sysdig capture files with the -w sysdig option, and then filter and analyze them later. For example, this command line will print duration, ID and tags of any trace that lasts more than 100ms.sysdig -r capture.scap -p "%span.duration.human %span.id %span.tags" "tracer.duration>100000000"
Analyze traces with Csysdig
Csysdig, the htop-inspired sysdig command line interactive interface, offers three new views to analyze tracers. Two of them, Traces Summary and Traces List allow interactive drill down-based span exploration (more info in the manual), while the third one, Traces Spectrogram, is a tracer-specific version of the award-winning sysdig spectrogram and is a pretty awesome way to display and investigate latencies in your apps or scripts. Take a look at this video.
Inspect system activity inside traces
Tracing latencies is useful, but why stop there? Sysdig lets you get deep system visibility into selected portions of your app by leveraging tracers.This is accomplished through the evtin class of filters. A couple of examples. This command line lists the file opens generated inside spans with 'query' as tag:sudo sysdig evt.type=open and evtin.span.tag=queryWhile this one prints all the data sent or received on the network by spans with tag 'srvc_node7':sudo sysdig -c echo_fds evtin.span.tag=srvc_node7
Trace-Aware Log Monitoring
A powerful application of the just described filtering technique is the ability to capture and visualize logs on a per span basis. This is accomplished by using sysdig's spy_logs chisel in conjunction with evtin* filters. For example, this command line prints the log entries written by any span in the trace with ID 123:sudo sysdig -c echo_fds evtin.span.id=123
Export trace latencies using statsd
Want to pipe span latency information to your monitoring backend of choice? There's a chisel for that! Just run:sudo sysdig -c tracers_2_statsd " "Where *ip* and *port* are the statsd server endpoint information. Sysdig Tracers: lightweight APM that works even in your bash scripts Click to tweet
Conclusions
A good way to think about sysdig tracers is that they are a mix between Zipkin-style transaction tracing, strace-like data collection and an htop-inspired interface. We put a lot of effort in making them lightweight and simple to use, so they should help you in both development and production environments.This is just an initial release. We plan to extend the feature set quite a bit, for example with integrations for the most common languages, so stay tuned and feel free to give us feedback. Happy tracing!