Meet the only benchmark for cloud security
今すぐ見る
カスタムメトリクスのコストを 75% 削減し、より多くを観察しましょう
Prometheusモニタリングを選ぶ理由
Prometheus は、クラウドネイティブアプリケーションやサービスの可観測性(オブザーバビリティ)を変革しています。オープンソースプロジェクトとしての Prometheus は、コンテナ、Kubernetes、サービス、アプリケーション全体のメトリクスを収集・保存・クエリするための標準的な手法を提供します。Sysdig Monitor は Prometheus と完全互換であるため、Prometheus エコシステムへの投資を無駄にすることなく、エンタープライズ向けの高度な機能を活用できます。
私たちは Prometheus を中心に多くの仕組みを構築してきましたが、Sysdig を導入したことで、これらのメトリクスを実際に活用できるようになりました。Sysdig の Prometheus への対応、そして PromQL への対応は、他にはない特長です。
WORLDPAY社 主任コンテナプラットフォームエンジニア
Prometheusモニタリングのユースケース
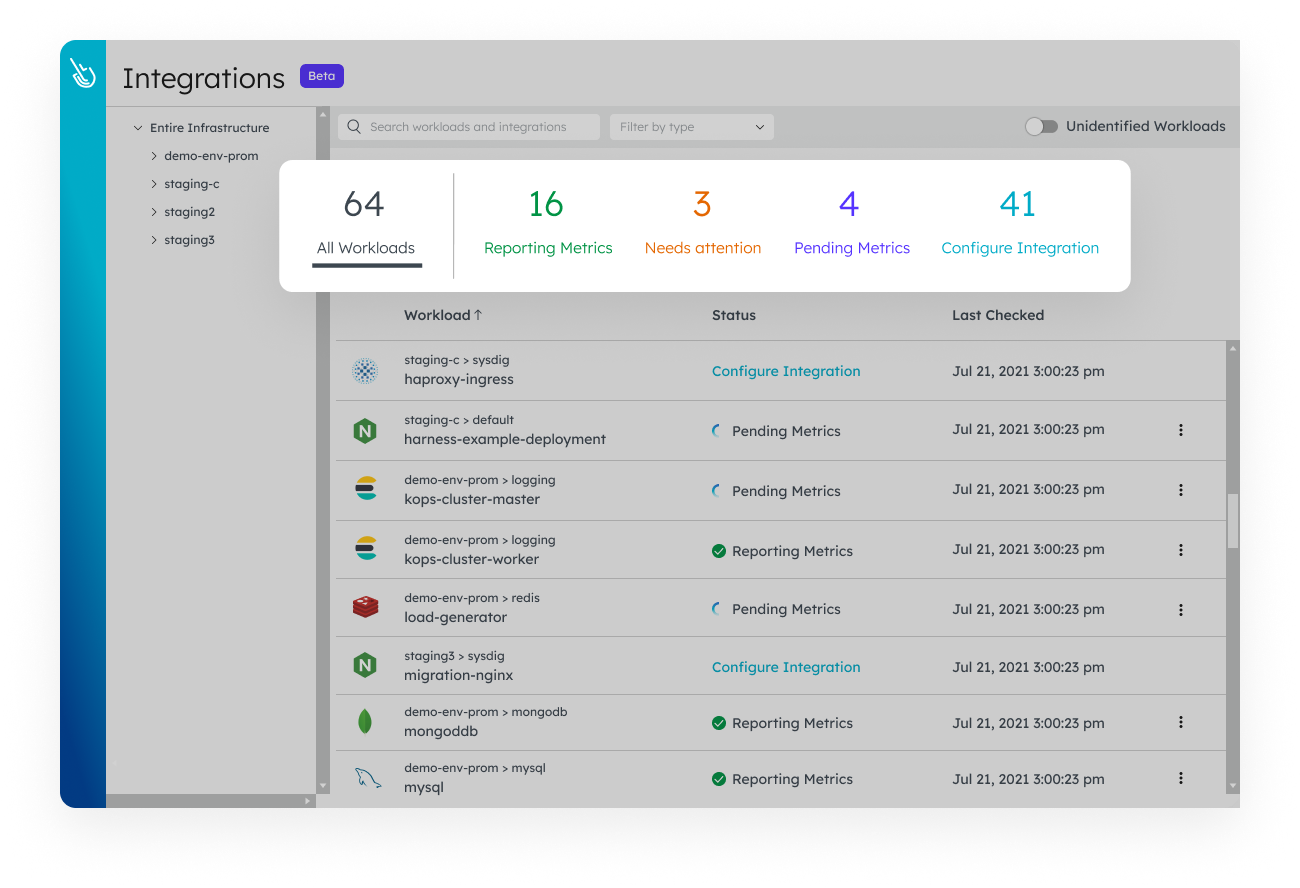
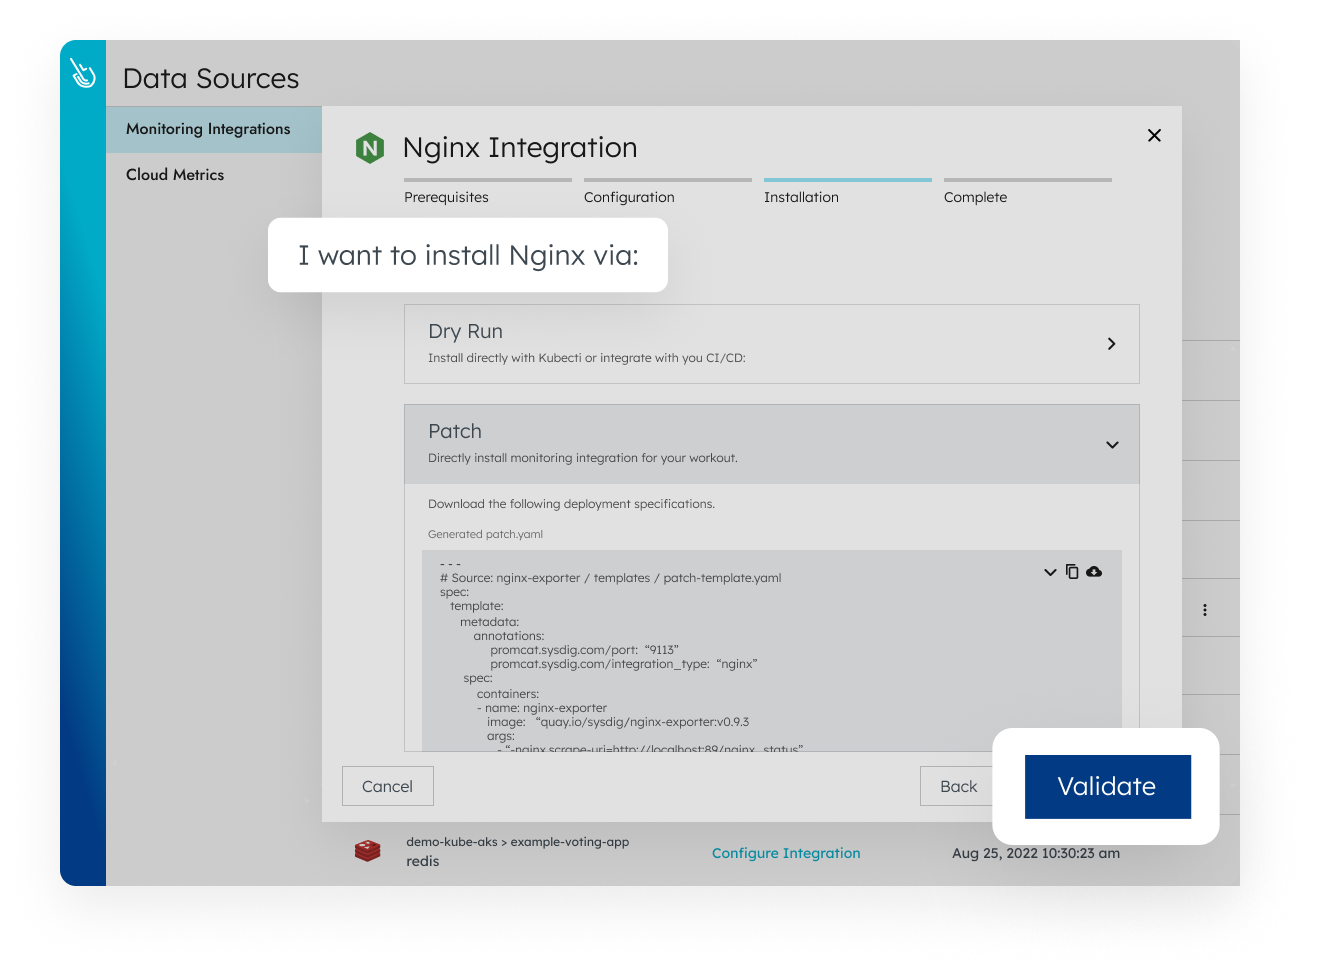
Prometheusマネージドサービス
自動サービス検出やガイド付き統合デプロイメントなど、エンタープライズ機能を備えたフルマネージド型の Prometheus モニタリングサービス
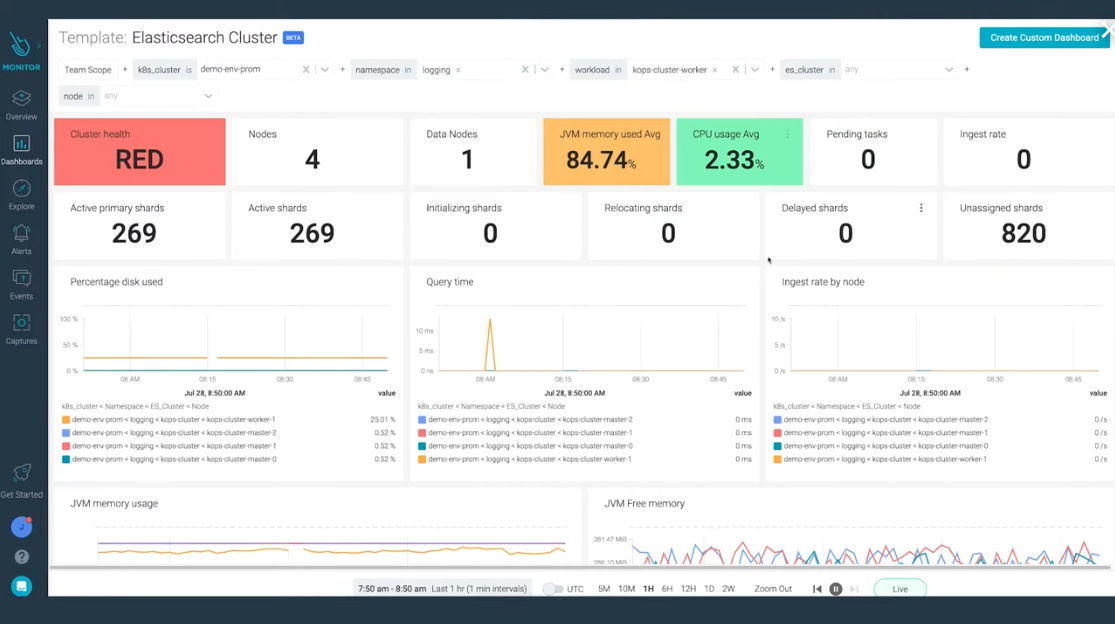
ダッシュボードとクエリ
シンプルなフォームベースの操作で Prometheus の時系列データをクエリでき、さらに強力な Prometheus Query Language(PromQL) を使って、ダッシュボードやアラートを柔軟に構築することも可能です
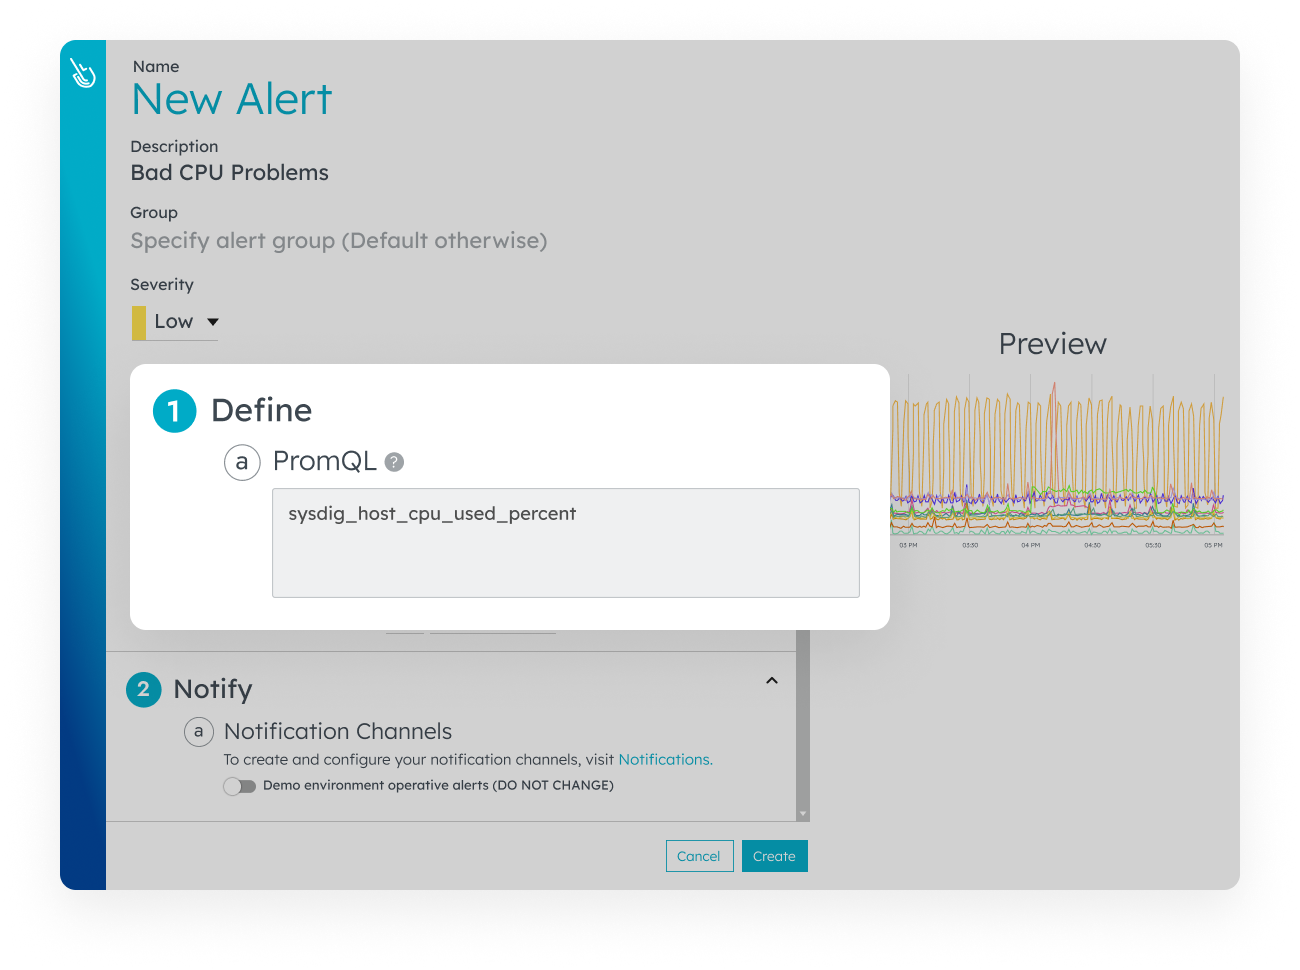
Prometheusアラート
Prometheus の監視メトリクスにアラートを設定し、環境全体で発生するアプリケーションの問題を自動通知で検知できます。さらに、既存のレコーディングルールをインポートすることで、設定をよりスピーディーに行うことが可能です
シンプルな構成とストレージ
Sysdig エージェントがメトリクスを自動で取得し、バックエンドでは環境全体を一元的に可視化しながら、長期的な時系列データの保存を実現します
参考資料
オンデマンドウェビナー
How to Monitor OpenShift with Sysdig Monitor
How to Monitor OpenShift with Sysdig Monitor

オンデマンドウェビナー
Cut Custom Metrics Cost by 75% and Observe More
Cut Custom Metrics Cost by 75% and Observe More